Liechtenstein

| Government | |
| Name | Principality of Liechtenstein |
| German | Fürstentum Liechtenstein |
| Government type | constitutional monarchy |
| Capital | Vaduz (5,696 (2019)) |
| Currency | Swiss franc (CHF) |
| People | |
| Population (2020) | 38,137 (217th) |
| Density of population | 237 P/km2 (57th) |
| Nationality | Liechtensteiner |
| Official languages | |
| German | |
| Ethnic groups | |
| Liechtensteiner | 66% |
| Swiss | 9.6% |
| Austrian | 5.8% |
| German | 4.3% |
| Italian | 3.1% |
| other | 11.2% |
| Religions (2015) | |
| Roman Catholic (official) | 73.4% |
| Protestant Reformed | 6.3% |
| Muslim | 5.9% |
| Christian Orthodox | 1.3% |
| Lutheran | 1.2% |
| other Protestant | .7% |
| other Christian | 0.3% |
| other | 0.8% |
| none | 7% |
| unspecified | 3.3% |
| Life expectancy (2020) | |
| Male | 79.9 years |
| Female | 85 years |
| Total population | 82.2 years (21st) |
| Homicides | |
| Total (2018) | 2.6 per 100,000 people (85th) |
| Geography | |
| Land area | 160 km2 |
| water area | 0 km2 |
| total area | 160 km2 (219th) |
| Lowest point | |
| Ruggeller Riet | 430 m |
| Highest point | |
| Vorder-Grauspitz | 2,599 m |
| Land use (2011) | |
| Agricultural land | 37.6% |
| Arable land | 18.8% |
| Permanent crops | 0% |
| Permanent pasture | 18.8% |
| Forest | 43.1% |
| Other | 19.3% |
| Urbanization | |
| Urban population (2020) | 14.4% |
| Rate of urbanization | 0.81% annual rate of change (2015 – 2020) |
| Economy | |
| Labor force (2015) | 38,520 (199th) |
| note: 51% of the labor force in Liechtenstein commute daily from Austria, Switzerland, and Germany | |
| Labor force by occupation (2015) | |
| Agriculture | 0.8% |
| Industry | 36.9% |
| Services | 62.3% |
| Unemployment rate (2015) | 2.4% (24th) |
| GDP (PPP) (estimate 2013) | |
| Total | $5.3 billion (149th) |
| Per capita | $98,432 (1st) |
| GDP (nominal) (estimate 2010) | |
| Total | $5.155 billion (147th) |
| Per capita | $143,151 (2nd) |
| GDP by sector (estimate 2014) | |
| Agriculture | 7% |
| Industry | 41% |
| Services | 52% |
| Exports (2015) | $3.217 billion (127th) |
| note: trade data exclude trade with Switzerland | |
| Exports partners | |
| NA | |
| Imports (2014) | $2.23 billion (163rd) |
| Imports partners | |
| NA | |
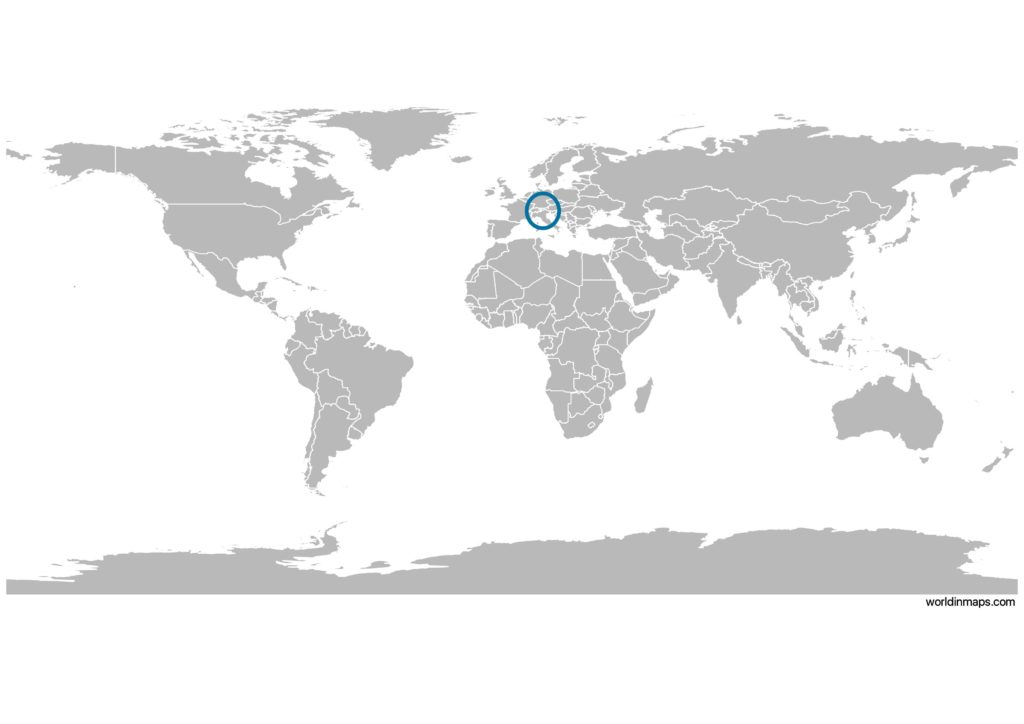
Liechtenstein on the world map
Demography
Age structure data
Estimate for 2020:
- 0-14 years: 15.2% (male 3,259/female 2,688)
- 15-24 years: 11.29% (male 2,238/female 2,181)
- 25-54 years: 40.22% (male 7,869/female 7,872)
- 55-64 years: 14.41% (male 2,711/female 2,930)
- 65 years and over: 18.88% (male 3,403/female 3,986)
Remark: the age structure of a population affects a nation’s key socioeconomic issues. Countries with young populations (high percentage under age 15) need to invest more in schools, while countries with older populations (high percentage ages 65 and over) need to invest more in the health sector. The age structure can also be used to help predict potential political issues. For example, the rapid growth of a young adult population unable to find employment can lead to unrest.
Population from 1950 to 2020
Source: United Nations, Department of Economic and Social Affairs, Population Division (2019). World Population Prospects 2019, Online Edition. Rev. 1.
Economy
Agriculture:
wheat, barley, corn, potatoes, livestock, dairy products
Industries:
electronics, metal manufacturing, dental products, ceramics, pharmaceuticals, food products, precision instruments, tourism, optical instruments
Exports – commodities:
small specialty machinery, connectors for audio and video, parts for motor vehicles, dental products, hardware, prepared foodstuffs, electronic equipment, optical products
Imports – commodities:
agricultural products, raw materials, energy products, machinery, metal goods, textiles, foodstuffs, motor vehicles
Time zone and current time in Liechtenstein
Go to our interactive map to get the current time in Liechtenstein