Home / countries / Luxembourg / Population
Population of Luxembourg
Population size
Source: United Nations, Department of Economic and Social Affairs, Population Division (2019). World Population Prospects 2019, Online Edition. Rev. 1.
Luxembourg had a population of 625 976 in 2020. It makes Luxembourg the 168th most populated country in the world. In 1960 the population was around 300 000 people and it has more than double in 60 years. This growth is exceptional in regards to the neighboring countries. This demographic growth was mainly caused by immigration. Indeed the migration rate of the Luxembourg was about 7.7% between 1960 and 2011. On the opposite it was only 1.1% for the 27 countries of the European Union for the same period. This rate was even around 10% in the 90s. As a consequence, 47.2 % of the population are foreigners in 2021.
Density of population
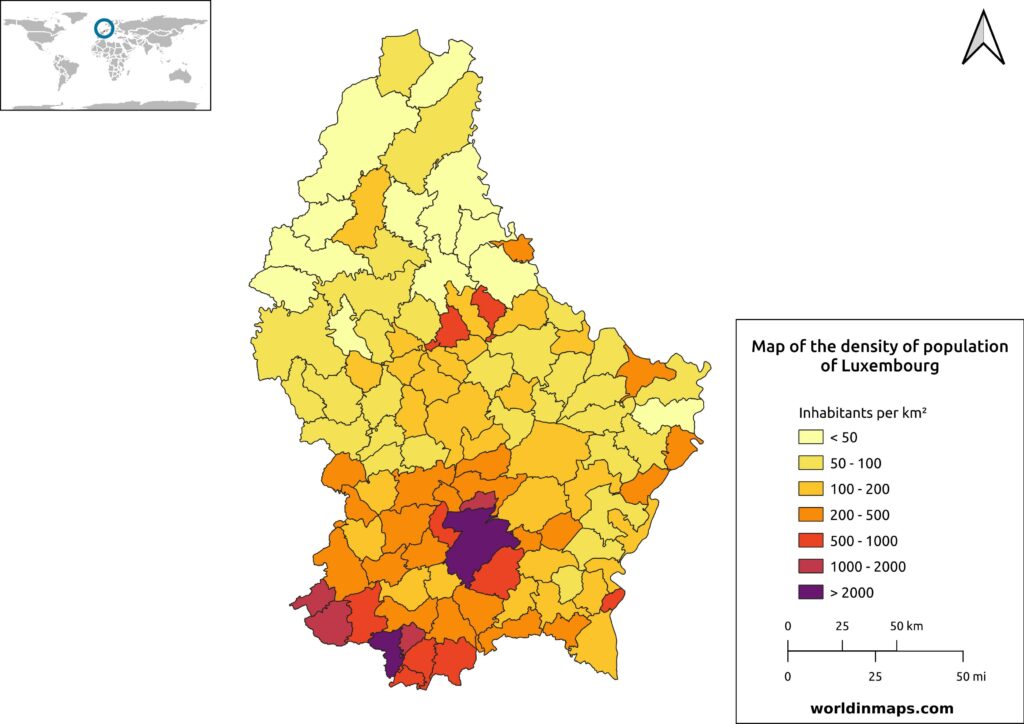
In 2020, Luxembourg had a density of population of 242 inhabitants / km² (627 inhabitants / sq mi). Luxembourg is the 58th in the ranking of the population density in the world. The map shows clearly the difference between the 2 geographical regions of Luxembourg. The Oesling, located in the northern part of the country, is much less densely populated then the Gutland. Most of the population concentrates around the 2 largest cities of Luxembourg: Luxembourg city and Esch-sur-Alzette.
Biggest cities of Luxembourg
| City | Canton | Population (2021) |
|---|---|---|
| Luxembourg | Luxembourg | 124 509 |
| Esch-sur-Alzette | Esch-sur-Alzette | 36 228 |
| Differdange | Esch-sur-Alzette | 27 869 |
| Dudelange | Esch-sur-Alzette | 21 513 |
| Pétange | Esch-sur-Alzette | 20 084 |
| Sanem | Esch-sur-Alzette | 17 895 |
| Hesperange | Luxembourg | 15 657 |
| Bettembourg | Esch-sur-Alzette | 11 374 |
| Schifflange | Esch-sur-Alzette | 11 291 |
| Käerjeng | Capellen | 10 517 |
Luxembourg has only one city of above 100 000 inhabitants and most of the big cities are located in the canton of Esch-sur-Alzette, which is the second most populated after the Canton of Luxembourg. The 3 cantons containing the 10 most populated cities are all located next to each one in the southern par of Luxembourg. They also represent the highest density of population.
Population pyramid
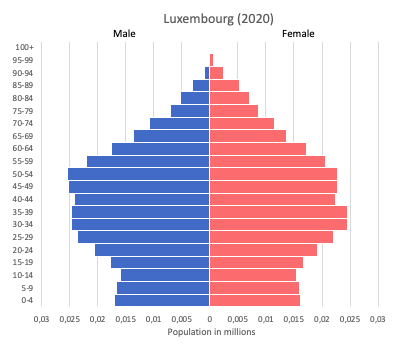
The population pyramid of Luxembourg has the typical form of a constrictive population pyramid, which are characteristic of an elderly and shrinking population. But it is important to note that there is a very big proportion of the population in the age range of 25 to 54 years. They represent the foreigner labor force.
Age structure
Estimate for 2020:
- 0-14 years: 16.73% (male 54,099/female 51,004)
- 15-24 years: 11.78% (male 37,946/female 36,061)
- 25-54 years: 43.93% (male 141,535/female 134,531)
- 55-64 years: 12.19% (male 39,289/female 37,337)
- 65 years and over: 15.37% (male 43,595/female 52,984)
Remark: the age structure of a population affects a nation’s key socioeconomic issues. Countries with young populations (high percentage under age 15) need to invest more in schools, while countries with older populations (high percentage ages 65 and over) need to invest more in the health sector. The age structure can also be used to help predict potential political issues. For example, the rapid growth of a young adult population unable to find employment can lead to unrest.
Like for the population pyramid, the proportion of the population in the working age is very high, indeed 43.93% of the population is aged between 25 and 54 years. This is essentially due to the immigration.
Life expectancy
Evolution of the life expectancy from 1960 to 2018
Source: World Development Indicators, The World Bank
Luxembourg has one of the highest life expectancy in the world. The life expectancy in 2020 was 82.6 years for the total population. Luxembourg rank 16th in the world for the life expectancy. The difference between men and women is 5.1 years. The life expectancy in Luxembourg for men is 80.1 years (2020) and it is 85.2 years for women (2020). In 1960 the life expectancy was 68.4. So the life expectancy has increase of 14.2 years in 60 years.
Ethnic groups
Distribution of the ethnic groups in 2019:
| Luxembourger | 51.1% |
| Portuguese | 15.7% |
| French | 7.5% |
| Italian | 3.6% |
| Belgian | 3.3% |
| German | 2.1% |
| Spanish | 1.1% |
| British | 1% |
| Other | 14.6% |
Only 51.1% of the population of Luxembourg are Luxembourger. Nearly the half the population are immigrants. This very big proportion of foreigners is the consequence of the economic attractiveness of the Grand Duchy of Luxembourg.
Languages
Because of its position at the crossing of different country with a different language and its size, Luxembourg is a multilingual country. Luxembourgish is the only official languages of the country, but Luxembourg has 3 administration languages. French and German are the 2 other languages used in administration. As a consequence, every question to the official administration in Luxembourg can be done and answered in Luxembourgish, French and German.
Religions
Distribution of the religions in Luxembourg in 2010:
| Christian | 70.4% |
| Muslim | 2.3% |
| Other | 0.5% |
| None | 26.8% |
The majority of the population is Christian, mainly catholic with 65.9% and in less extends protestants with 3.2%. 26.8% of the population of Luxembourg are not affiliated with any religions.
Other demographic data
| Homicides (2017) | 0.3 per 100 000 people (169 th) |