Federated States of Micronesia

| Government | |
| Name | Federated States of Micronesia |
| Government type | federal republic in free association with the US |
| Capital | Palikir (6,647 (2010)) |
| Currency | United States dollar (USD) |
| People | |
| Population (2020) | 115,021 (198th) |
| Density of population | 158.1 P/km2 (75th) |
| Nationality | Micronesian |
| Official languages | |
| English | |
| Ethnic groups (2010) | |
| Chuukese / Mortlockese | 49.3% |
| Pohnpeian | 29.8% |
| Kosraean | 6.3% |
| Yapese | 5.7% |
| Yap outer islanders | 5.1% |
| Polynesian | 1.6% |
| Asian | 1.4% |
| other | 0.8% |
| Religions (2010) | |
| Roman Catholic | 54.7% |
| Protestant | 41.1% |
| Congregational | 38.5% |
| Baptist | 1.1% |
| Seventh Day Adventist | 0.8% |
| Assembly of God | 0.7% |
| Mormon | 1.5% |
| other | 1.9% |
| none | 0.7% |
| unspecified | 0.1% |
| Life expectancy (2020) | |
| Male | 71.8 years |
| Female | 76.1 years |
| Total population | 73.9 years (137st) |
| Homicides | |
| n.a. | |
| Geography | |
| Land area | 702 km2 |
| water area | 0 km2 |
| total area | 702 km2 (192nd) |
| Lowest point | |
| Pacific Ocean | 0 m |
| Highest point | |
| Nanlaud on Pohnpei | 782 m |
| Land use (2011) | |
| Agricultural land | 25.5% |
| Arable land | 2.3% |
| Permanent crops | 19.7% |
| Permanent pasture | 3.5% |
| Forest | 74.5% |
| Other | 0% |
| Urbanization | |
| Urban population (2020) | 22.9% |
| Rate of urbanization | 1.05% annual rate of change (2015 – 2020) |
| Economy | |
| Labor force (2010) | 37,920 (200th) |
| Labor force by occupation (2013) | |
| Agriculture | 0.9% |
| Industry | 5.2% |
| Services | 93.9% |
| note: around 65% of the labor force are government employees | |
| Unemployment rate (2010) | 16.2% (177th) |
| GDP (PPP) (estimate 2019) | |
| Total | $367 million |
| Per capita | $3,584 |
| GDP (nominal) (estimate 2019) | |
| Total | $383 million |
| Per capita | $3,735 |
| GDP by sector (estimate 2013) | |
| Agriculture | 26.3% |
| Industry | 18.9% |
| Services | 54.8% |
| Exports (2013) | $88.3 million (197th) |
| Exports partners | |
| NA | |
| Imports (2015) | $167.8 million (212th) |
| Imports partners | |
| NA | |
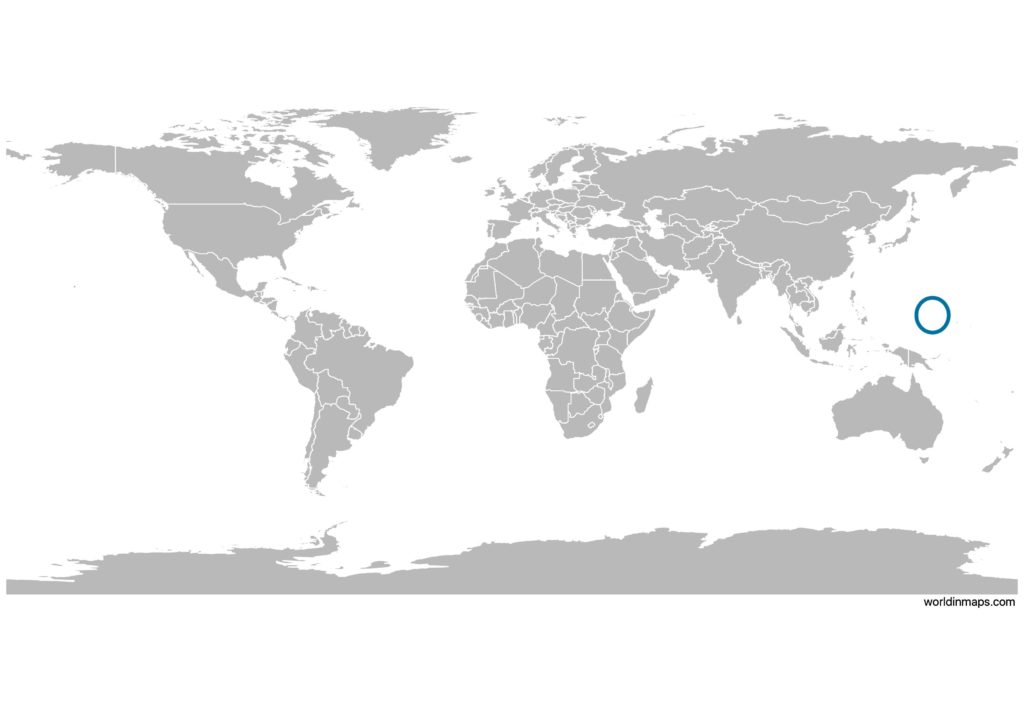
Federated States of Micronesia on the world map
Demography
Age structure data
Estimate for 2020:
- 0-14 years: 28.88% (male 15,046/female 14,542)
- 15-24 years: 18.94% (male 9,710/female 9,696)
- 25-54 years: 40.32% (male 19,903/female 21,395)
- 55-64 years: 7.24% (male 3,572/female 3,842)
- 65 years and over: 4.62% (male 2,130/female 2,600)
Remark: the age structure of a population affects a nation’s key socioeconomic issues. Countries with young populations (high percentage under age 15) need to invest more in schools, while countries with older populations (high percentage ages 65 and over) need to invest more in the health sector. The age structure can also be used to help predict potential political issues. For example, the rapid growth of a young adult population unable to find employment can lead to unrest.
Population from 1950 to 2020
Source: United Nations, Department of Economic and Social Affairs, Population Division (2019). World Population Prospects 2019, Online Edition. Rev. 1.
Evolution of the life expectancy from 1960 to 2018
Source: World Development Indicators, The World Bank
Economy
Agriculture:
taro, yams, coconuts, bananas, cassava (manioc, tapioca), sakau (kava), Kosraen citrus, betel nuts, black pepper, fish, pigs, chickens
Industries:
tourism, construction, specialized aquaculture, craft items (shell and wood)
Exports – commodities:
fish, sakau (kava), betel nuts, black pepper
Imports – commodities:
food, beverages, clothing, computers, household electronics, appliances, manufactured goods, automobiles, machinery and equipment, furniture, tools
Time zone and current time in Federated States of Micronesia
Go to our interactive map to get the current time in Federated States of Micronesia