South Sudan
| Government | |
| Name | Republic of South Sudan |
| Government type | presidential republic |
| Capital | Juba (230,195 (2008)) |
| Currency | South Sudanese pound (SSP) |
| People | |
| Population (2020) | 11,193,729 (75th) |
| Density of population | 13.33 P/km2 (214th) |
| Nationality | South Sudanese |
| Official languages | |
| English | |
| Ethnic groups | |
| Dinka (Jieng) | |
| Nuer (Naath) | |
| Shilluk (Chollo) | |
| Azande | |
| Bari | |
| Kakwa | |
| Kuku | |
| Murle | |
| Mandari | |
| Didinga | |
| Ndogo | |
| Bviri | |
| Lndi | |
| Anuak | |
| Bongo | |
| Lango | |
| Dungotona | |
| Acholi | |
| Baka | |
| Fertit | |
| Religions | |
| animist | |
| Christian | |
| Muslim | |
| Life expectancy (2020) | |
| Male | 54.6 years |
| Female | 56.5 years |
| Total population | 55.5 years (223rd) |
| Homicides | |
| Total (2012) | 13.9 per 100,000 people (25th) |
| Geography | |
| Land area | NA |
| water area | NA |
| total area | 644,329 km2 (43rd) |
| Lowest point | |
| White Nile | 381 m |
| Highest point | |
| Kinyeti | 3,187 m |
| Land use (2011) | |
| Agricultural land | 100% |
| Arable land | 0% |
| Permanent crops | 0% |
| Permanent pasture | 100% |
| Forest | 0% |
| Other | 0% |
| Urbanization | |
| Urban population (2020) | 20.2% |
| Rate of urbanization | 4.1% annual rate of change (2015 – 2020) |
| Economy | |
| Labor force | NA |
| Labor force by occupation | |
| Agriculture | NA |
| Industry | NA |
| Services | NA |
| Unemployment rate | NA |
| GDP (PPP) (estimate 2018) | |
| Total | $18.435 billion |
| Per capita | $1,420 (222nd) |
| GDP (nominal) (estimate 2018) | |
| Total | $3.194 billion |
| Per capita | $246 |
| GDP by sector | |
| Agriculture | NA |
| Industry | NA |
| Services | NA |
| Exports (2016) | $1.13 billion (155th) |
| Exports partners | |
| NA | |
| Imports (2016) | $3.795 billion (140th) |
| Imports partners | |
| NA | |
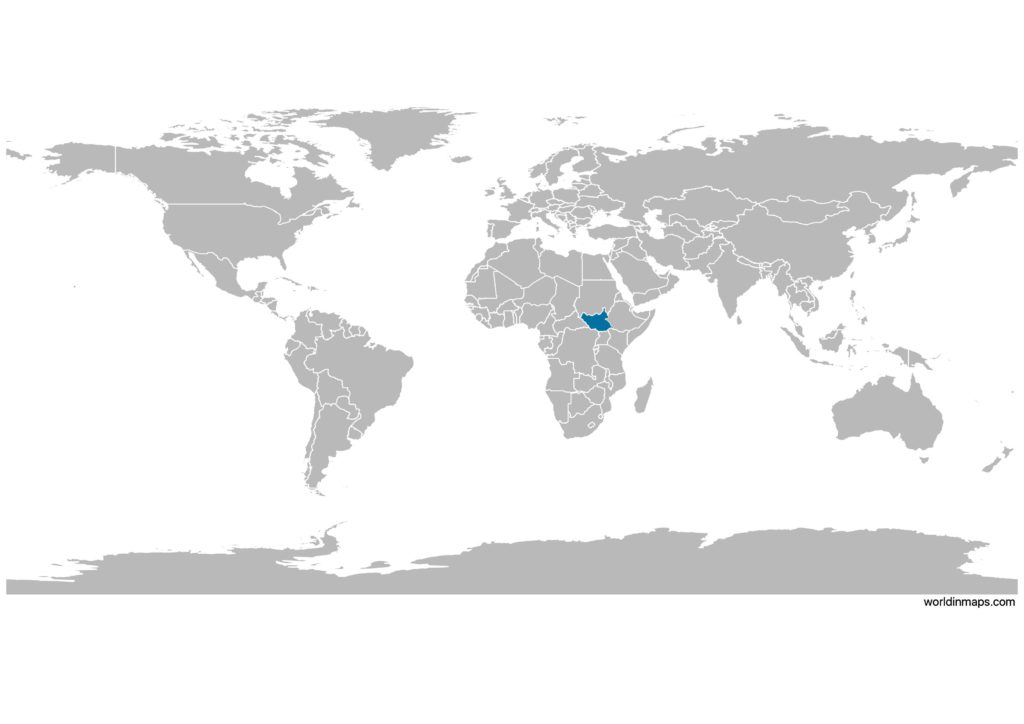
South Sudan on the world map
South Sudan top 10 largest cities (2008)
- Juba (230,195)
- Wau (118,331)
- Malakal (114,528)
- Yambio (105,881)
- Yei (69,720)
- Renk (69,079)
- Aweil (59,217)
- Maridi (55,602)
- Bentiu (41,328)
- Bor (25,188)
Demography
Population pyramid
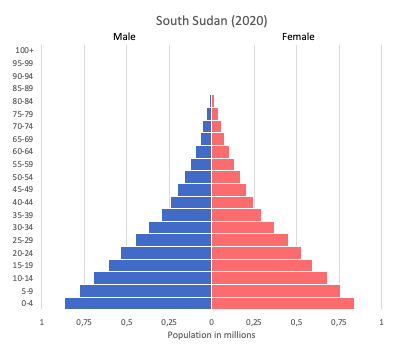
Age structure data
Estimate for 2020:
- 0-14 years: 41.58% (male 2,238,534/female 2,152,685)
- 15-24 years: 21.28% (male 1,153,108/female 1,094,568)
- 25-54 years: 30.67% (male 1,662,409/female 1,577,062)
- 55-64 years: 3.93% (male 228,875/female 186,571)
- 65 years and over: 2.53% (male 153,502/female 113,930)
Remark: the age structure of a population affects a nation’s key socioeconomic issues. Countries with young populations (high percentage under age 15) need to invest more in schools, while countries with older populations (high percentage ages 65 and over) need to invest more in the health sector. The age structure can also be used to help predict potential political issues. For example, the rapid growth of a young adult population unable to find employment can lead to unrest.
Population from 1950 to 2020
Source: United Nations, Department of Economic and Social Affairs, Population Division (2019). World Population Prospects 2019, Online Edition. Rev. 1.
Evolution of the life expectancy from 1960 to 2018
Source: World Development Indicators, The World Bank
Economy
Agriculture:
sorghum, maize, rice, millet, wheat, gum arabic, sugarcane, mangoes, papayas, bananas, sweet potatoes, sunflower seeds, cotton, sesame seeds, cassava (manioc, tapioca), beans, peanuts, cattle, sheep
Industries:
NA
Exports – commodities:
NA
Imports – commodities:
NA
Time zone and current time in South Sudan
Go to our interactive map to get the current time in South Sudan