Bhutan
| Government | |
| Name | Kingdom of Bhutan |
| Dzongkha | འབྲུག་རྒྱལ་ཁབ་ Druk Gyal Khap |
| Government type | Constitutional monarchy |
| Capital | Thimphu (114,551 (2017)) |
| Currency | Ngultrum (BTN) |
| Organization | |
| Member State | South Asian Association for Regional Cooperation (SAARC) |
| People | |
| Population (2020) | 771,612 (165th) |
| Density of population | 19.3 P/km2 (162nd) |
| Nationality | Bhutanese |
| Official languages | |
| Dzongkha | |
| Ethnic groups | |
| Ngalop (also known as Bhote) | 50% |
| Ethnic Nepali (predominantly Lhotshampas) | 35% |
| Indigenous or migrant tribes | 15% |
| Religions (2005) | |
| Lamaistic Buddhist | 75.3% |
| Indian- and Nepali-influenced Hinduism | 22.1% |
| Other | 2.6% |
| Life expectancy (2020) | |
| Male | 71 years |
| Female | 73.2 years |
| Total population | 72.1 years (154th) |
| Homicides | |
| Total (2018) | 1.2 per 100,000 people (133rd) |
| Geography | |
| Land area | 38,394 km2 |
| water area | 0 km2 |
| total area | 38,394 km2 (137th) |
| Mean elevation | 2,220 m |
| Lowest point | |
| Drangeme Chhu | 97 m |
| Highest point | |
| Gangkar Puensum | 7,570 m |
| Land use (2011) | |
| Agricultural land | 13.6% |
| Arable land | 2.6% |
| Permanent crops | 0.3% |
| Permanent pasture | 10.7% |
| Forest | 85.5% |
| Other | 0.9% |
| Urbanization | |
| Urban population (2020) | 42.3 |
| Rate of urbanization | 2.98% annual rate of change (2015 – 2020) |
| Economy | |
| Labor force (2017) | 397,900 (160th) |
| Labor force by occupation (2015) | |
| Agriculture | 58% |
| Industry | 20% |
| Services | 22% |
| Unemployment rate (2017) | 3.2% (39th) |
| GDP (PPP) (estimate 2018) | |
| Total | $7.701 billion |
| Per capita | $9,426 (115th) |
| GDP (nominal) (estimate 2018) | |
| Total | $2.547 billion |
| Per capita | $3,117 (130th) |
| GDP by sector (estimate 2017) | |
| Agriculture | 16.2% |
| Industry | 41.8% |
| Services | 42% |
| Exports (2017) | $554.6 million (173rd) |
| Exports partners (2017) | |
| India | 95.3% |
| Imports (2017) | $1.025 billion (185th) |
| Imports partners (2017) | |
| India | 89.5% |
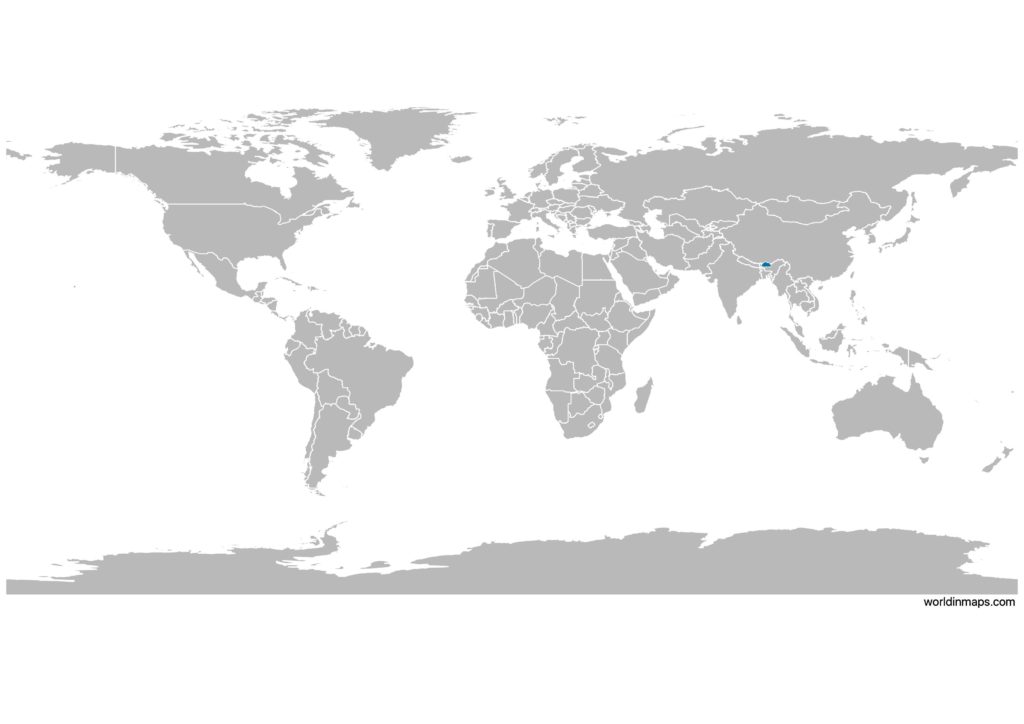
Bhutan on the world map
Bhutan top 10 largest cities (2017)
- Thimphu (114,551)
- Phuntsholing (27,658)
- Paro (11,448)
- Gelephu (9,858)
- Samdrup Jongkhar (9,325)
- Wangdue Phodrang (8,954)
- Punakha (6,262)
- Jaka (6,243)
- Nganglam (5,418)
- Samtse (5,396)
Demography
Population pyramid
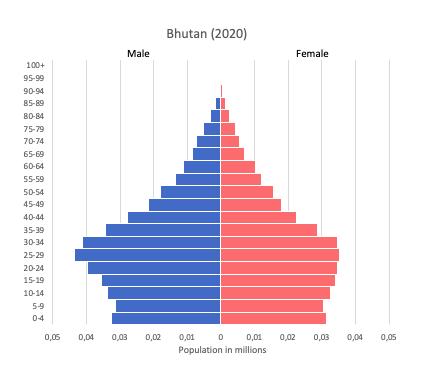
Age structure data
Estimate for 2020:
- 0-14 years: 24.52% (male 98,113/female 93,740)
- 15-24 years: 17.77% (male 70,768/female 68,211)
- 25-54 years: 44.72% (male 184,500/female 165,374)
- 55-64 years: 6.39% (male 26,714/female 23,280)
- 65 years and over: 6.6% (male 26,797/female 24,821)
Remark: the age structure of a population affects a nation’s key socioeconomic issues. Countries with young populations (high percentage under age 15) need to invest more in schools, while countries with older populations (high percentage ages 65 and over) need to invest more in the health sector. The age structure can also be used to help predict potential political issues. For example, the rapid growth of a young adult population unable to find employment can lead to unrest.
Population from 1950 to 2020
Source: United Nations, Department of Economic and Social Affairs, Population Division (2019). World Population Prospects 2019, Online Edition. Rev. 1.
Evolution of the life expectancy from 1960 to 2018
Source: World Development Indicators, The World Bank
Economy
Agriculture:
rice, corn, root crops, citrus, dairy products, eggs
Industries:
cement, wood products, processed fruits, alcoholic beverages, calcium carbide, tourism
Exports – commodities:
electricity (to India), ferrosilicon, cement, cardamom, calcium carbide, steel rods/bars, dolomite, gypsum
Imports – commodities:
fuel and lubricants, airplanes, machinery and parts, rice, motor vehicles
Time zone and current time in Bhutan
Go to our interactive map to get the current time in Bhutan