Home / countries / Netherlands / Population
Population of The Netherlands
Population size
Population from 1950 to 2020
Source: United Nations, Department of Economic and Social Affairs, Population Division (2019). World Population Prospects 2019, Online Edition. Rev. 1.
The Netherlands had a population of 17 134 873 in 2020. It makes it the 68th most populated country in the world. In 1900 the population of the Netherlands was only of around 5 million people. It has doubled between 1900 and 1950 to arrive at about 10 million people. The chart above shows the population for each year between 1950 and 2020. We can see that there was a change in the growth rate around 1980, where the population was around 14 million. After 1980 the growth rate has slow down and the population was about 15.93 million in 2000. The chart shows that the population growth has also slowed down in the last 10 years.
Density of population
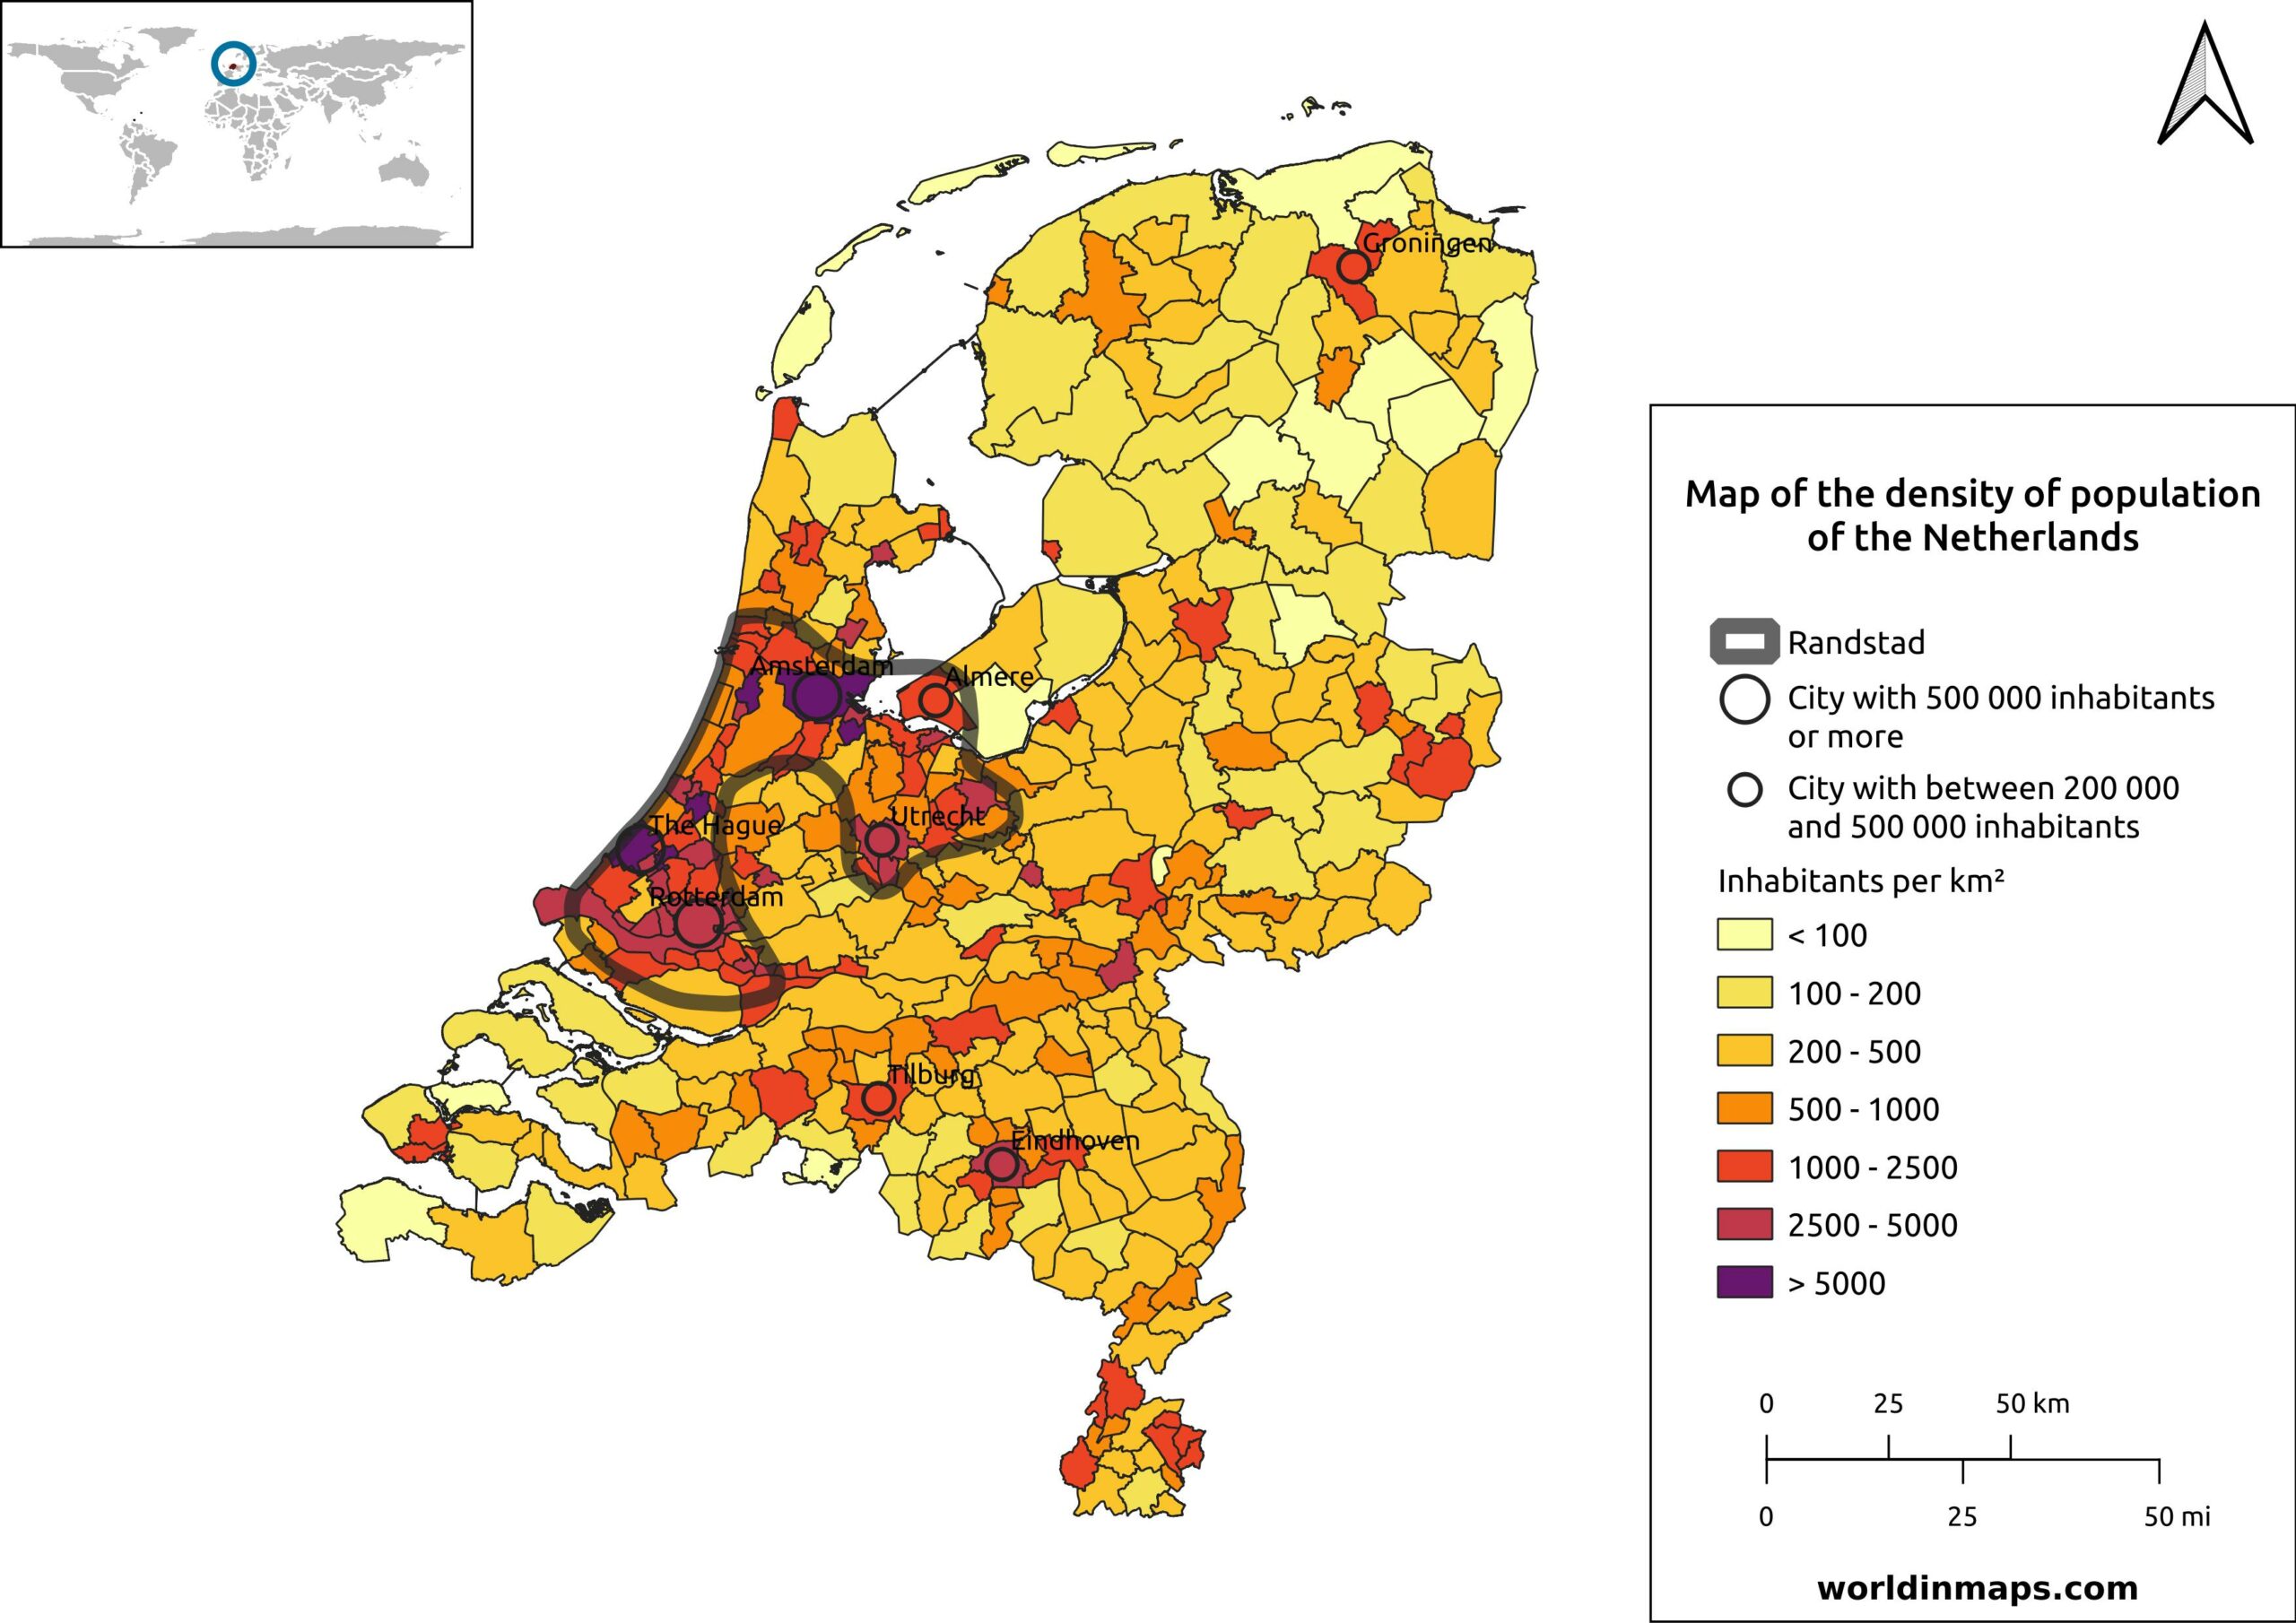
The Netherlands has a density of population of 421 inhabitants / km². It makes the Netherlands the 16th most densely populated country in the world. But a big part of The Netherlands (around 18%) is covered by water, which gives a real density of population of 501 inhabitants / km² (1 350 inhabitants / sq mi).
Because of this high density, the Netherlands has recovered land from the sea with polders. The last big poldering project took place between 1927 and 1968 with the creation of an entire province, the Flevoland. More than 400 000 people live nowadays in this new province and it has an outstanding density of population of 299 inhabitants / km².
Biggest cities in The Netherlands
| City | Province | Population (2020) |
|---|---|---|
| Amsterdam | North Holland | 869 709 |
| Rotterdam | South Holland | 650 459 |
| The Hague | South Holland | 545 863 |
| Utrecht | Utrecht | 357 667 |
| Eindhoven | North Brabant | 233 983 |
| Groningen | Groningen | 231 112 |
| Tilburg | North Brabant | 219 599 |
| Almere | Flevoland | 213 660 |
| Breda | North Brabant | 183 790 |
| Nijmegen | Gelderland | 176 669 |
The Netherlands is densely populated, but there is no city of above 1 million inhabitants. However the 4 biggest cities can be considered as a single metropolitan area of over 7.5 million inhabitants. This metropolitan area is called the Randstad and it is one of the largest metropolitan regions of Europe. This region includes the port of Rotterdam (10th busiest container port in the world) and Amsterdam, but also the airport of Amsterdam (one of the busiest airport of Europe).
Population pyramid
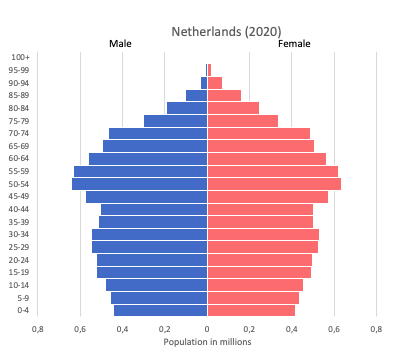
The population pyramid of the Netherlands has a typical form of a constrictive population pyramid. This is characteristic of a country with an elderly and a shrinking population. This kind of pyramid is typical of countries with high level of social and economic development, where access to quality education and health care are available for the majority of the population.
Age structure
Estimate for 2020:
- 0-14 years: 16.11% (male 1,425,547/female 1,358,894)
- 15-24 years: 11.91% (male 1,049,000/female 1,008,763)
- 25-54 years: 38.47% (male 3,334,064/female 3,313,238)
- 55-64 years: 13.69% (male 1,177,657/female 1,188,613)
- 65 years and over: 19.82% (male 1,558,241/female 1,866,380)
Remark: the age structure of a population affects a nation’s key socioeconomic issues. Countries with young populations (high percentage under age 15) need to invest more in schools, while countries with older populations (high percentage ages 65 and over) need to invest more in the health sector. The age structure can also be used to help predict potential political issues. For example, the rapid growth of a young adult population unable to find employment can lead to unrest.
Like analyse in the previous section, the Dutch population is ageing, due to the increase of life expectancy and the low population growth. This is a critical issue for the health care and the social security policy of the country. Indeed, the proportion of people of working age decreases and this will cause problems with the current system of old age pensions. The cost of the health care system are also critical because they will increase with an ageing population.
Life expectancy
Evolution of the life expectancy from 1960 to 2018
Source: World Development Indicators, The World Bank
The life expectancy in 2020 was 81.7 years for the total population, which make Netherlands rank 28th in the world. Like in every country, there is a difference between the man and woman, these latter lives indeed longer. The life expectancy for men is 79.5 years and 84.1 years for women. Like in every developed country, the life expectancy has increased due the developments in medicine. It was 73.4 years for the total population in 1960, so it is an increase of 8.3 years in 60 years.
Ethnic groups
Distribution of the ethnic groups in 2021 (estimation):
| Dutch | 75.4% |
| EU (excluding Dutch) | 6.4% |
| Turkish | 2.4% |
| Moroccan | 2.4% |
| Surinamese | 2.1% |
| Indonesian | 2% |
| Other | 9.3% |
A bit less than a quart of the population of the Netherlands is not Dutch. The first groups of foreigner are EU citizen. The Eu citizen are mainly from Belgium, Germany and Poland.
Languages
In the autonomous regions of the Netherlands (European mainland) is Dutch the official language. In the province of Friesland, the Frisian is recognized as a second official language.
In the 3 islands of the Antilles and that are part of the autonomous state of the Netherlands (as special municipalities), Papiamento and English are recognized as official languages for regional use in addition of Dutch.
The Netherlands has other provincial dialect, but these are not officially recognized.
Religions
Distribution of the religions in 2017:
| Roman Catholic | 23.6% | |
| Protestant | Dutch Reformed | 6.4% |
| Protestant Church of The Netherlands | 5.6% | |
| Calvinist | 2.9% | |
| Total of the protestant | 14.9% | |
| Muslim | 5.1% | |
| Other | 5.6% | |
| None | 50.7% | |
50.7% of the Dutch declares that they have no religion. The Muslim community represents around 5.1% and they are mainly of Turkish and Moroccan origins. The jews are not distinguished in this data because they nowadays represent only around 30 000 members, although they were much more important before the Shoah.
Other demographic data
| Homicides | 0.6 per 100 000 people (157th) |