Belarus
| Government | |
| Name | Republic of Belarus |
| Belarusian | Рэспубліка Беларусь |
| Russian | Республика Беларусь |
| Government type | Presidential republic |
| Capital | Minsk (2,020,600 (2020)) |
| Currency | Belarusian ruble (BYN) |
| Organization | |
| Member State | Commonwealth of Independent States (CIS) |
| People | |
| Population (2020) | 9,449,321 (93rd) |
| Density of population | 45.8 P/km2 (142nd) |
| Nationality | Belarusian |
| Official languages | |
| Russian | |
| Belarusian | |
| Ethnic groups (2009) | |
| Belarusian | 83.7% |
| Russian | 8.3% |
| Polish | 3.1% |
| Ukrainian | 1.7% |
| Other | 2.4% |
| Unspecified | 0.9% |
| Religion (2011) | |
| Orthodox | 48.3% |
| Catholic | 7.1% |
| Other | 3.5% |
| Non-believers | 41.1% |
| Life expectancy (2020) | |
| Male | 68.3 years |
| Female | 79.5 years |
| Total population | 73.8 years (139th) |
| Homicides | |
| Total (2018) | 2.4 per 100,000 people (95th) |
| Geography | |
| Land area | 202,900 km2 |
| water area | 4,700 km2 |
| total area | 207,600 km2 (87th) |
| Mean elevation | 160 m |
| Lowest point | |
| Nyoman River | 90 m |
| Highest point | |
| Dzyarzhynskaya Hara | 346 m |
| Land use (2016) | |
| Agricultural land | 43.7% |
| Arable land | 27.2% |
| Permanent crops | 0.6% |
| Permanent pasture | 15.9% |
| Forest | 42.7% |
| Other | 13.6% |
| Urbanization | |
| Urban population (2020) | 79.5% |
| Rate of urbanization | 0.44% annual rate of change (2015 – 2020) |
| Economy | |
| Labor force (2016) | 4.381 million (89th) |
| Agriculture | 9.7% |
| Industry | 23.4% |
| Services | 66.8% |
| Unemployment rate (2017) | 0.8% (6th) |
| GDP (PPP) (estimate 2020) | |
| Total | $200.089 billion (69th) |
| Per capita | $21,223(66th) |
| GDP (nominal) (estimate 2020) | |
| Total | $63.582 billion (75th) |
| Per capita | $6,744 (84th) |
| GDP by sector (estimate 2017) | |
| Agriculture | 8.1% |
| Industry | 40.8% |
| Services | 51.1% |
| Exports (2017) | $28.65 billion (66th) |
| Exports partners (2017) | |
| Russia | 43.9% |
| Ukraine | 11.5% |
| UK | 8.2% |
| Imports (2017) | $31.58 billion (64th) |
| Imports partners (2017) | |
| Russia | 57.2% |
| China | 8% |
| Germany | 5.1% |
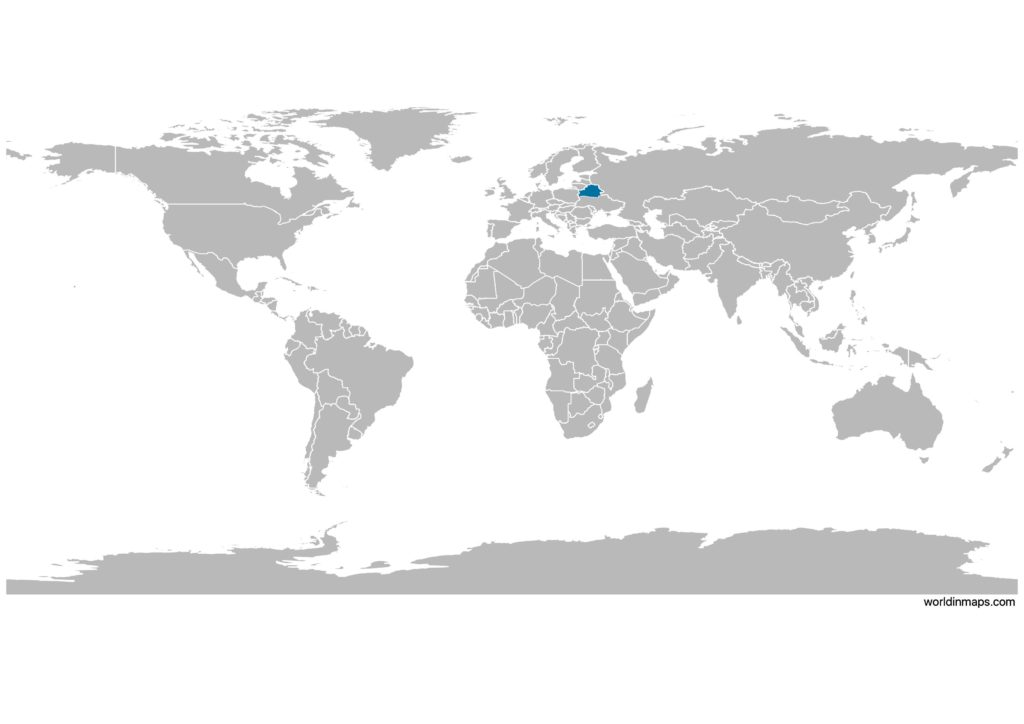
Belarus on the world map
Belarus top 10 largest cities
- Minsk (1,992,685)
- Homyel (536,938)
- Mahilyow (383,313)
- Vitsyebsk (378,459)
- Hrodna (373,547)
- Brest (350,616)
- Babruysk (216,793)
- Baranavichy (179,000)
- Barysaw (142,681)
- Pinsk (137,960)
Demography
Population pyramid
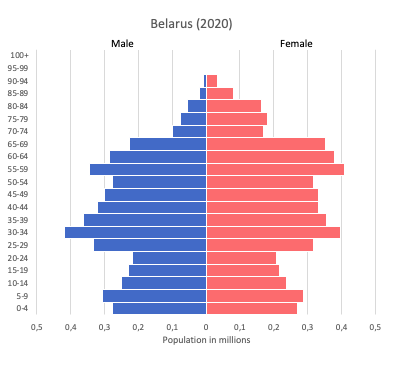
Age structure data
Estimate for 2020:
- 0-14 years: 16.09% (male 784,231/female 740,373)
- 15-24 years: 9.59% (male 467,393/female 441,795)
- 25-54 years: 43.94% (male 2,058,648/female 2,105,910)
- 55-64 years: 14.45% (male 605,330/female 763,972)
- 65 years and over: 15.93% (male 493,055/female 1,017,211)
Remark: the age structure of a population affects a nation’s key socioeconomic issues. Countries with young populations (high percentage under age 15) need to invest more in schools, while countries with older populations (high percentage ages 65 and over) need to invest more in the health sector. The age structure can also be used to help predict potential political issues. For example, the rapid growth of a young adult population unable to find employment can lead to unrest.
Population from 1950 to 2020
Source: United Nations, Department of Economic and Social Affairs, Population Division (2019). World Population Prospects 2019, Online Edition. Rev. 1.
Evolution of the life expectancy from 1960 to 2018
Source: World Development Indicators, The World Bank
Economy
Agriculture:
grain, potatoes, vegetables, sugar beets, flax, beef, milk
Industries:
metal-cutting machine tools, tractors, trucks, earthmovers, motorcycles, synthetic fibers, fertilizer, textiles, refrigerators, washing machines and other household appliances
Exports – commodities:
machinery and equipment, mineral products, chemicals, metals, textiles, foodstuffs
Imports – commodities:
mineral products, machinery and equipment, chemicals, foodstuffs, metals
Time zone and current time in Belarus
Go to our interactive map to get the current time in Belarus