Russia
| Government | |
| Name | Russian Federation |
| Russian | Российская Федерация Rossiyskaya Federatsiya |
| Government type | semi-presidential federation |
| Capital | Moscow (12,381,000 (2017)) |
| Currency | Russian ruble (RUB) |
| Organization | |
| Member State | Commonwealth of Independent States (CIS) |
| People | |
| Population (2020) | 145,934,460 (9th) |
| Density of population | 8.4 P/km2 (225th) |
| Nationality | Russian |
| Official languages | |
| Russian | |
| Ethnic groups (2010) | |
| Russian | 77.7% |
| Tatar | 3.7% |
| Ukrainian | 1.4% |
| Bashkir | 1.1% |
| Chuvash | 1% |
| Chechen | 1% |
| Other (nearly 200 national and ethnic groups) | 10.2% |
| unspecified | 3.9% |
| Religions (2017) | |
| Russian Orthodox | 71% |
| Roman Catholic | 1% |
| Other Christian | 2% |
| No religion | 15% |
| Islam | 10% |
| Other religion | 1% |
| Life expectancy (2020) | |
| Male | 66.3 years |
| Female | 77.8 years |
| Total population | 71.9 years (158th) |
| Homicides | |
| Total (2018) | 8.2 per 100,000 people (40th) |
| Geography | |
| Land area | 16,377,742 km2 |
| water area | 720,500 km2 |
| total area | 17,098,242 km2 (141st) |
| Mean elevation | 600 m |
| Lowest point | |
| Caspian Sea | -28 m |
| Highest point | |
| Gora El’brus | 5,642 m |
| Land use (2011) | |
| Agricultural land | 13.1% |
| Arable land | 7.3% |
| Permanent crops | 0.1% |
| Permanent pasture | 5.7% |
| Forest | 49.4% |
| Other | 37.5% |
| Urbanization | |
| Urban population (2020) | 74.8% |
| Rate of urbanization | 0.18% annual rate of change (2015 – 2020) |
| Economy | |
| Labor force (2017) | 76.53 million (6th) |
| Labor force by occupation (2016) | |
| Agriculture | 9.4% |
| Industry | 27.6% |
| Services | 63% |
| Unemployment rate (2017) | 5.2% (77th) |
| GDP (PPP) (estimate 2020) | |
| Total | $4.519 trillion (5th) |
| Per capita | $30,819 (50th) |
| GDP (nominal) (estimate 2020) | |
| Total | $1.657 trillion (11th) |
| Per capita | $11,305 (61st) |
| GDP by sector (estimate 2017) | |
| Agriculture | 4.7% |
| Industry | 32.4% |
| Services | 62.3% |
| Exports (2017) | $353 billion (14th) |
| Exports partners (2017) | |
| China | 10.9% |
| Netherlands | 10% |
| Germany | 7.1% |
| Belarus | 5.1% |
| Turkey | 4.9% |
| Imports (2017) | $238 billion (20th) |
| Imports partners (2017) | |
| China | 21.2% |
| Germany | 10.7% |
| US | 5.6% |
| Belarus | 5% |
| Italy | 4.5% |
| France | 4.2% |
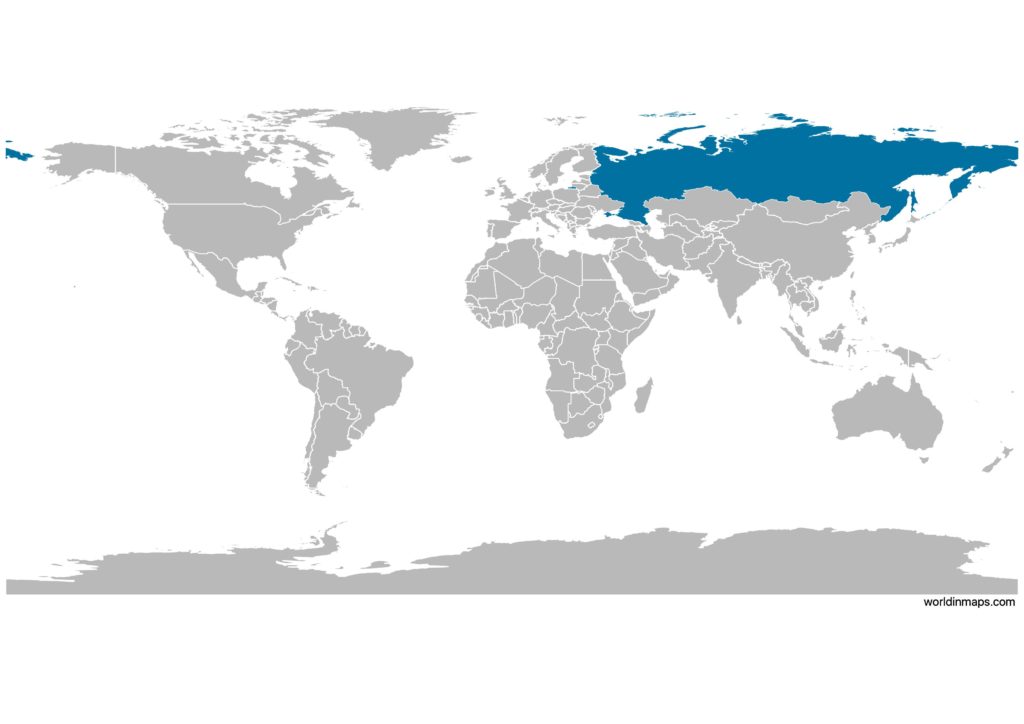
Russia on the world map
Russia top 10 largest cities (2017)
- Moscow (12,381,000)
- Saint Petersburg (5,282,000)
- Novosibirsk (1,603,000)
- Yekaterinburg (1,456,000)
- Nizhny Novgorod (1,267,000)
- Kazan (1,232,000)
- Chelyabinsk (1,199,000)
- Omsk (1,178,000)
- Samara (1,170,000)
- Ufa (1,126,000)
Demography
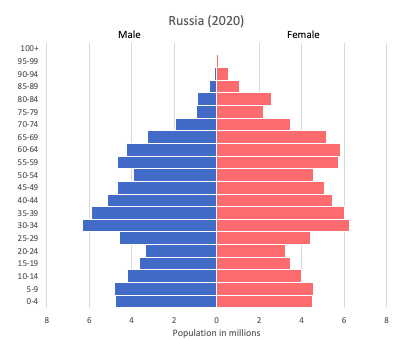
Population pyramid
Age structure data
Estimate for 2020:
- 0-14 years: 17.24% (male 12,551,611/female 11,881,297)
- 15-24 years: 9.54% (male 6,920,070/female 6,602,776)
- 25-54 years: 43.38% (male 30,240,260/female 31,245,104)
- 55-64 years: 14.31% (male 8,808,330/female 11,467,697)
- 65 years and over: 15.53% (male 7,033,381/female 14,971,679)
Remark: the age structure of a population affects a nation’s key socioeconomic issues. Countries with young populations (high percentage under age 15) need to invest more in schools, while countries with older populations (high percentage ages 65 and over) need to invest more in the health sector. The age structure can also be used to help predict potential political issues. For example, the rapid growth of a young adult population unable to find employment can lead to unrest.
Population from 1950 to 2020
Source: United Nations, Department of Economic and Social Affairs, Population Division (2019). World Population Prospects 2019, Online Edition. Rev. 1.
Density of population
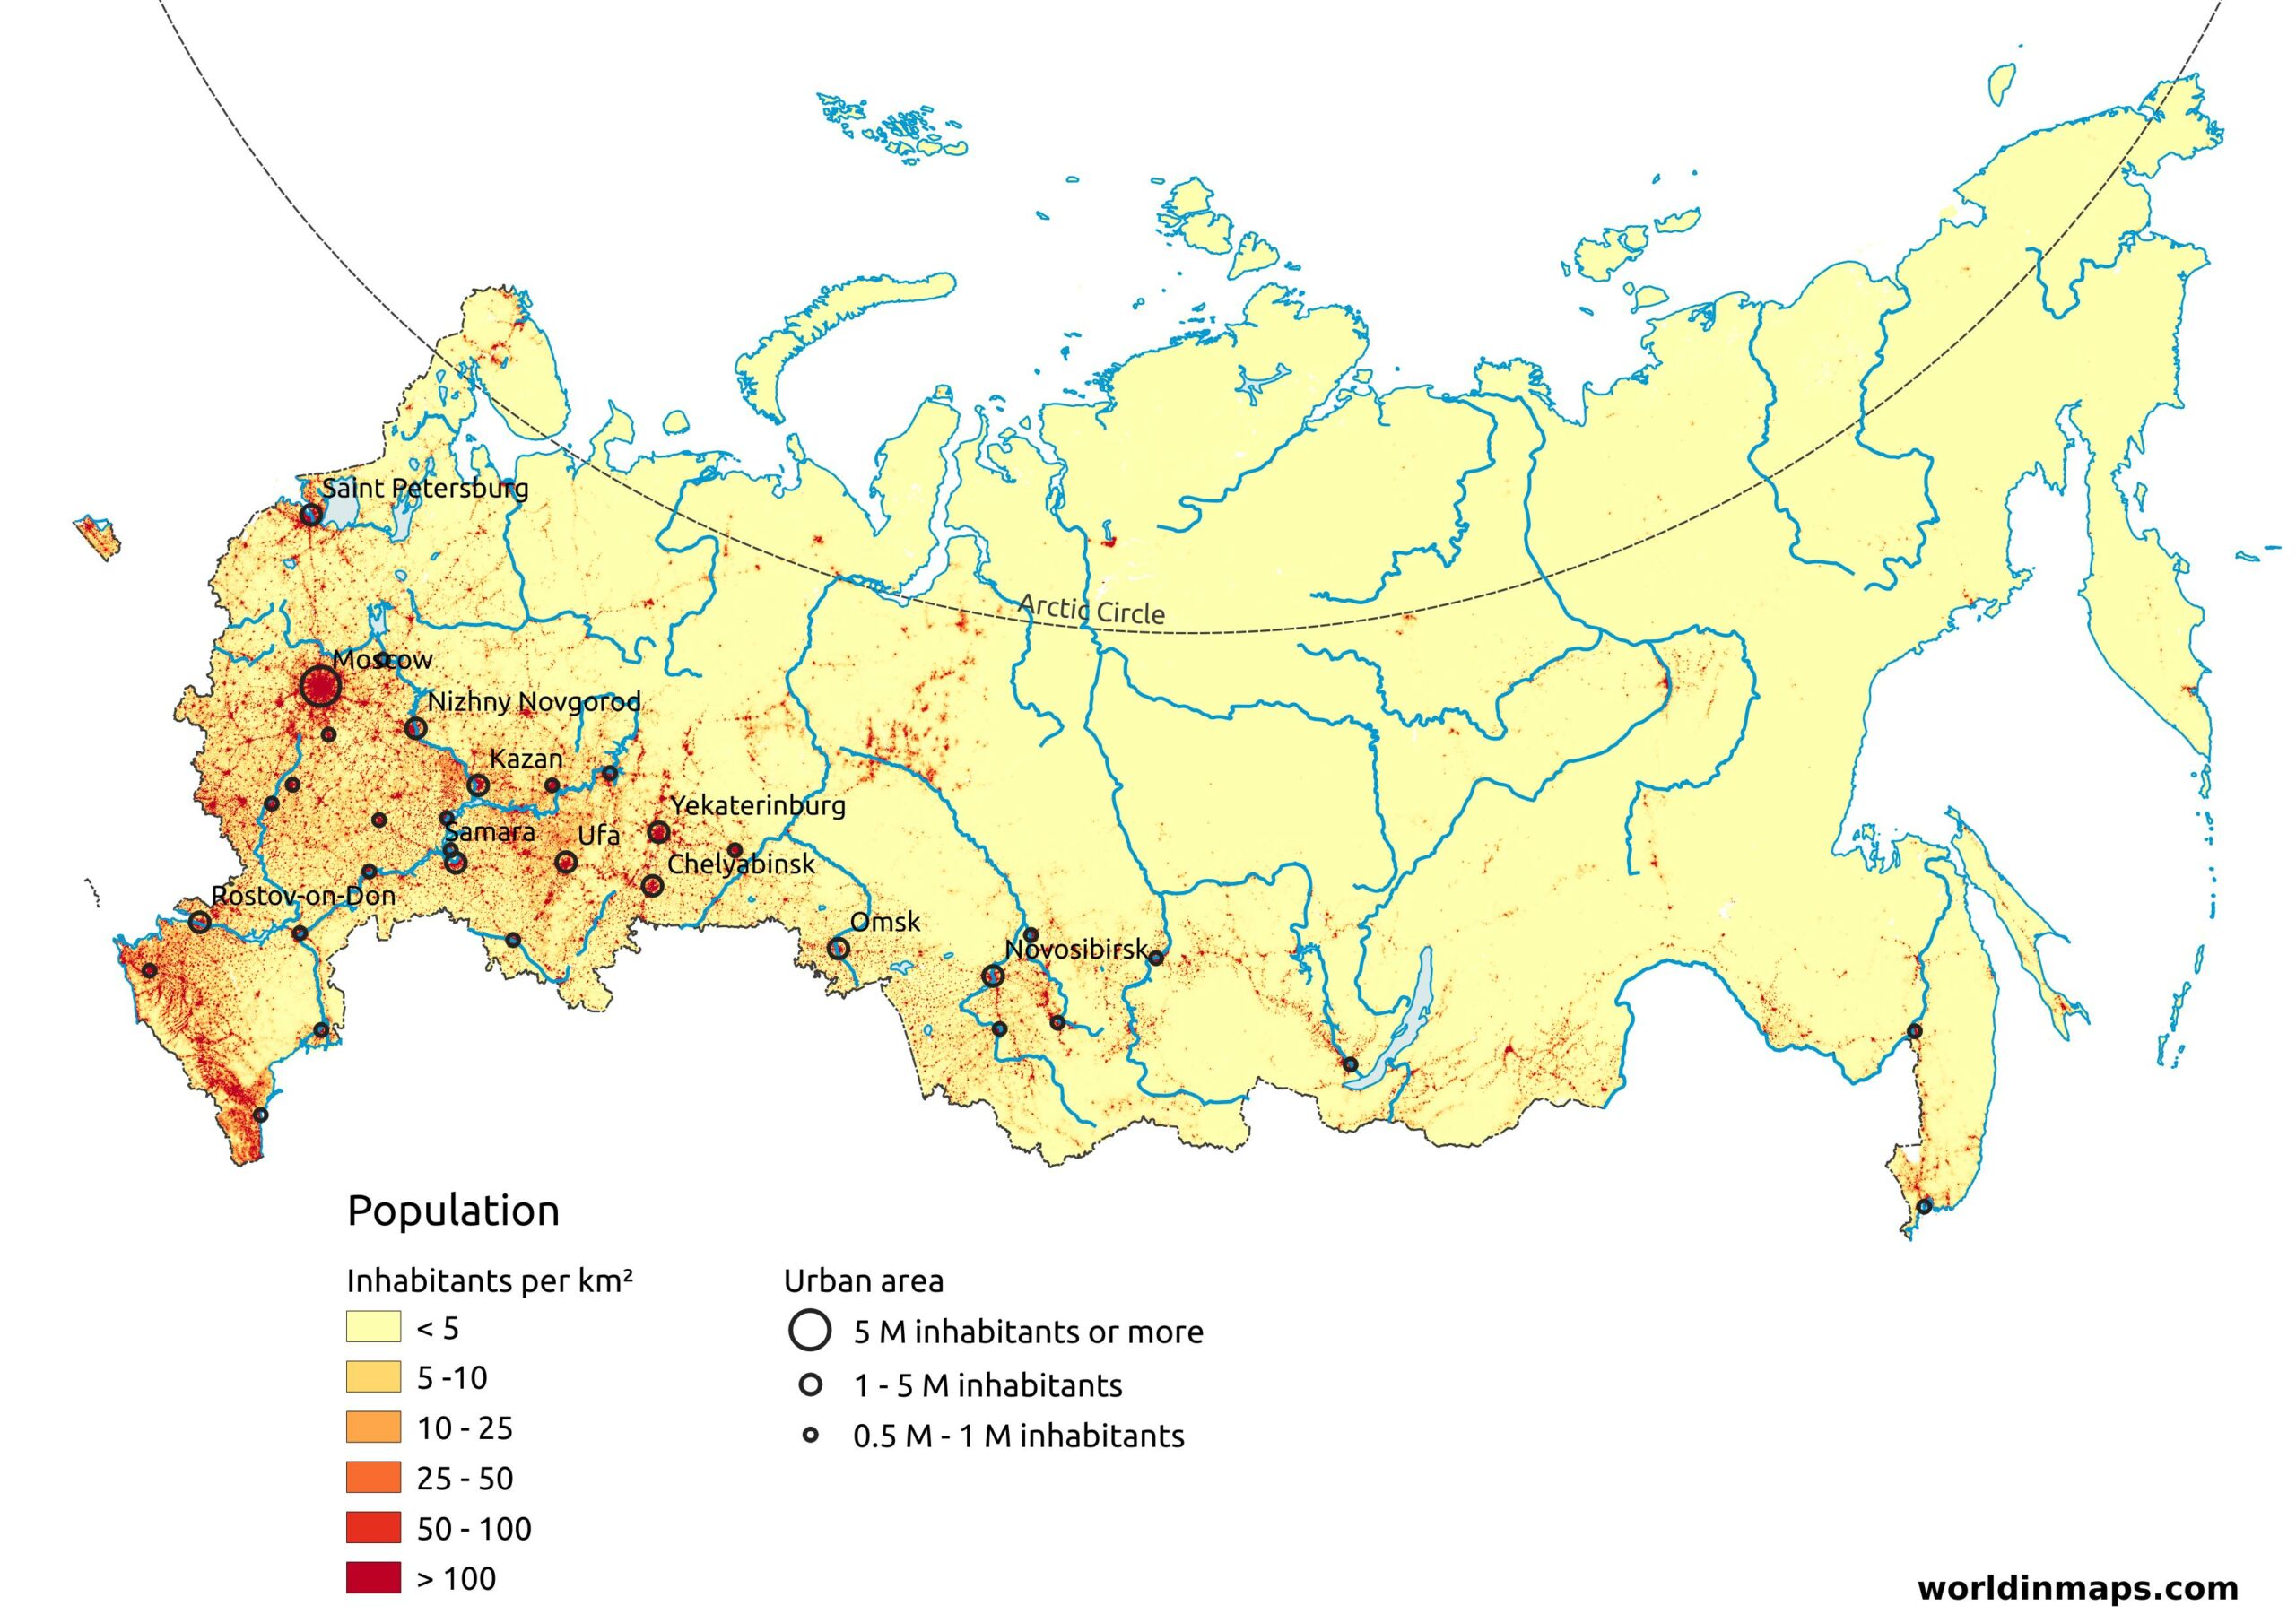
Russia has one of the lowest density of population in the world with 8.4 inhabitants per km² (22 inhabitants per sq mi). This is due to the severe climate of the major part of Russia. Indeed the north of Russia is located in the Arctic Circle.
Most of the population is concentrated in the European part of Russia, around Saint Petersburg, Moscow and the region south of Moscow. That region is under a more temperate climate.
Evolution of the life expectancy from 1960 to 2018
Source: World Development Indicators, The World Bank
Major rivers
- Lena River (4,294 km / 2,668 mi)
- Volga (3,690 km / 2,290 mi)
- Ural (2,428 km / 1,509 mi)
- Dnieper (2,290 km / 1,420 mi)
- Don (1,950 km / 1,210 mi)
- Pechora (1,809 km / 1,124 mi)
- Kama (1,805 km / 1,122 mi) (the longest left tributary of the Volga and the largest one in discharge)
- Oka (1,500 km / 930 mi) (the longest right tributary of Volga)
- Belaya (1,430 km / 890 mi) (tributary of Kama)
- Desna (1,130 km / 700 mi) (major left tributary of Dnieper)
- Donets (1,053 km / 654 mi) (major right tributary of Don River)
- Daugava (1,020 km / 630 mi)
Economy
Agriculture:
grain, sugar beets, sunflower seeds, vegetables, fruits; beef, milk
Industries:
complete range of mining and extractive industries producing coal, oil, gas, chemicals, and metals; all forms of machine building from rolling mills to high-performance aircraft and space vehicles; defense industries (including radar, missile production, advanced electronic components), shipbuilding; road and rail transportation equipment; communications equipment; agricultural machinery, tractors, and construction equipment; electric power generating and transmitting equipment; medical and scientific instruments; consumer durables, textiles, foodstuffs, handicrafts
Exports – commodities:
petroleum and petroleum products, natural gas, metals, wood and wood products, chemicals, and a wide variety of civilian and military manufactures
Imports – commodities:
machinery, vehicles, pharmaceutical products, plastic, semi-finished metal products, meat, fruits and nuts, optical and medical instruments, iron, steel
Time zone and current time in Russia
Go to our interactive map to get the current time in Russia
History
- Russia in 1700
- Siberia was known by European from the Middle age to the 20th century as making part of Tartary.