China
| Government | |
| Name | People’s Republic of China |
| Chinese | 中华人民共和国 |
| Pinyin | Zhōnghuá Rénmín Gònghéguó |
| Government type | Communist party-led state |
| Capital | Beijing 16,446,900 (2010)) |
| Currency | Renminbi (yuan) (CNY) |
| Organization | |
| Observer State | South Asian Association for Regional Cooperation (SAARC) |
| People | |
| Population (2020) | 1,439,323,774 (1st) |
| Density of population | 145 P/km2 (83rd) |
| Nationality | Chinese |
| Official languages | |
| Standard Chinese or Mandarin | |
| Zhuang (official in Guangxi Zhuang) | |
| Yue (official in Guangdong) | |
| Mongolian (official in Nei Mongol) | |
| Uighur (official in Xinjiang Uygur) | |
| Kyrgyz (official in Xinjiang Uygur) | |
| Tibetan (official in Xizang (Tibet)) | |
| Ethnic groups (2010) | |
| Han Chinese | 91.6% |
| Zhuang | 1.3% |
| Other | 7.1% |
| China officially recognizes 56 ethnic groups. | |
| Religions (2010) | |
| Buddhist | 18.2% |
| Christian | 5.1% |
| Muslim | 1.8% |
| Folk religion | 21.9% |
| Hindu | <0.1% |
| Jewish | <0.1% |
| Other | 0.7% |
| Unaffiliated | 52.2% |
| Life expectancy (2020) | |
| Male | 74 years |
| Female | 78.4 years |
| Total population | 76.1 years (104st) |
| Homicides | |
| Total (2018) | 0.5 per 100,000 people (160th) |
| Geography | |
| Land area | 9,326,410 km2 |
| water area | 270,550 km2 |
| total area | 9,596,960 km2 (5th) |
| Mean elevation | 1,840 m |
| Lowest point | |
| Turpan Pendi | -154 m |
| Highest point | |
| Mount Everest ( highest point on earth above sea level) | 8,848 m |
| Land use (2011) | |
| Agricultural land | 54.7% |
| Arable land | 11.3% |
| Permanent crops | 1.6% |
| Permanent pasture | 41.8% |
| Forest | 22.3% |
| Other | 23% |
| Urbanization | |
| Urban population (2020) | 61.4% |
| Rate of urbanization | 2.42% annual rate of change (2015 – 2020) |
| Hong Kong and Macau are not included | |
| Economy | |
| Labor force (2017) | 806.7 million (1st) |
| Labor force by occupation (2016) | |
| Agriculture | 27.7% |
| Industry | 28.8% |
| Services | 43.5% |
| Unemployment rate (2017) note: data for registered urban unemployment (which excludes private enterprises and migrants) | 3.9% (48th) |
| GDP (PPP) (estimate 2020) | |
| Total | $29.471 trillion (1st) |
| Per capita | $20,984(67th) |
| GDP (nominal) (estimate 2020) | |
| Total | $15.269 trillion (2nd) |
| Per capita | $10,872 (67th) |
| GDP by sector (estimate 2017) | |
| Agriculture | 7.9% |
| Industry | 40.5% |
| Services | 51.6% |
| Exports (2018) | $2.49 trillion (1st) |
| Exports partners (2018) | |
| US | 19.2% |
| Hong Kong | 12.2% |
| Japan | 5.9% |
| South Korea | 4.4% |
| Imports (2018) | $2.14 trillion (2nd) |
| Imports partners (2018) | |
| South Korea | 9.7% |
| Japan | 8.6% |
| US | 7.3% |
| Germany | 5% |
| Australia | 4.9% |
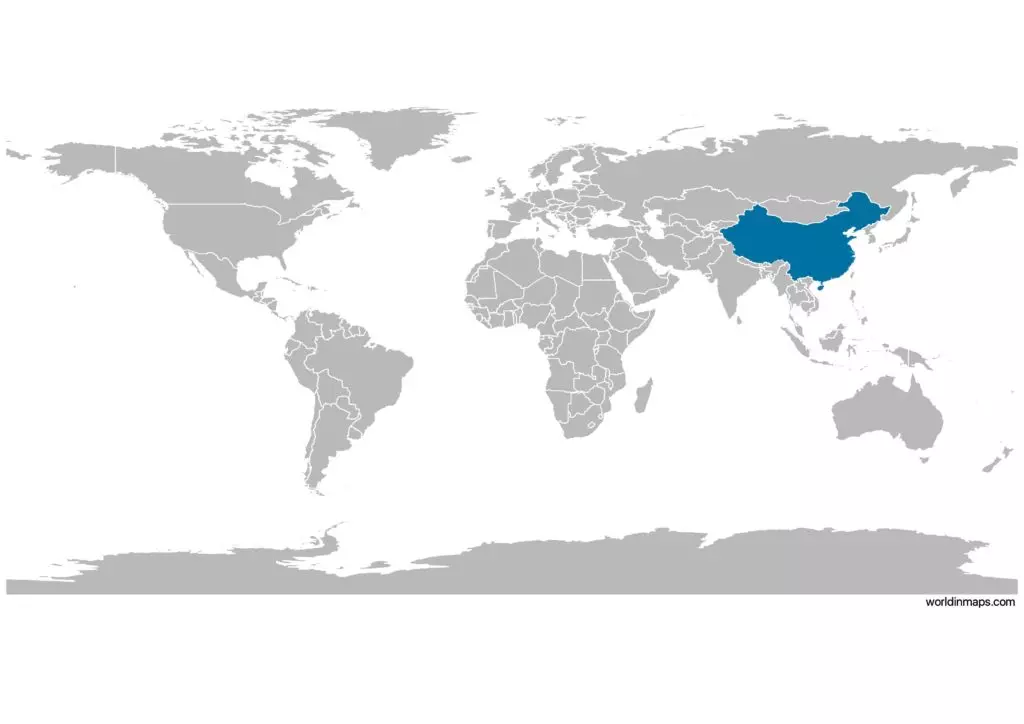
China on the world map
China top 10 largest cities (2010)
- Shanghai (20,217,700)
- Beijing (16,446,900)
- Chongqing (11,871,200)
- Guangzhou (10,641,400)
- Shenzhen (10,358,400)
- Tianjin (9,562,300)
- Wuhan (7,541,500)
- Dongguan (7,271,300)
- Hong Kong (7,055,071)
- Foshan (6,771,900)
Demography
Population pyramid
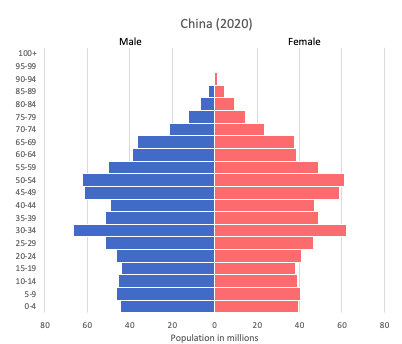
Age structure data
Estimate for 2020:
- 0-14 years: 17.29% (male 129,296,339/female 111,782,427)
- 15-24 years: 11.48% (male 86,129,841/female 73,876,148)
- 25-54 years: 46.81% (male 333,789,731/female 318,711,557)
- 55-64 years: 12.08% (male 84,827,645/female 83,557,507)
- 65 years and over: 12.34% (male 81,586,490/female 90,458,292)
Remark: the age structure of a population affects a nation’s key socioeconomic issues. Countries with young populations (high percentage under age 15) need to invest more in schools, while countries with older populations (high percentage ages 65 and over) need to invest more in the health sector. The age structure can also be used to help predict potential political issues. For example, the rapid growth of a young adult population unable to find employment can lead to unrest.
Population from 1950 to 2020
Source: United Nations, Department of Economic and Social Affairs, Population Division (2019). World Population Prospects 2019, Online Edition. Rev. 1.
Evolution of the life expectancy from 1960 to 2018
Source: World Development Indicators, The World Bank
Economy
Agriculture:
world leader in gross value of agricultural output; rice, wheat, potatoes, corn, tobacco, peanuts, tea, apples, cotton, pork, mutton, eggs; fish, shrimp
Industries:
world leader in gross value of industrial output; mining and ore processing, iron, steel, aluminum, and other metals, coal; machine building; armaments; textiles and apparel; petroleum; cement; chemicals; fertilizer; consumer products (including footwear, toys, and electronics); food processing; transportation equipment, including automobiles, railcars and locomotives, ships, aircraft; telecommunications equipment, commercial space launch vehicles, satellites
Exports – commodities:
electrical and other machinery, including computers and telecommunications equipment, apparel, furniture, textiles
Imports – commodities:
electrical and other machinery, including integrated circuits and other computer components, oil and mineral fuels, optical and medical equipment, metal ores, motor vehicles, soybeans
Time zone and current time in China
Go to our interactive map to get the current time in China
History
- The Qing Empire in 1700
- Part of China was known by European from the Middle age to the 20th century as making part of Tartary.