Eswatini (Swaziland)
| Government | |
| Name | Kingdom of Eswatini |
| Swazi | Umbuso weSwatini |
| Government type | absolute monarchy |
| Executive capital | Mbabane (76,218 (2005)) |
| Legislative and royal capital | Lobamba (4,557 (2005)) |
| Currency | Swazi lilangeni (SZL) South African rand (ZAR) |
| Organization | |
| Member State | Commonwealth of Nations |
| People | |
| Population (2020) | 1,160,164 (155th) |
| Density of population | 68.2 P/km2 (135th) |
| Nationality | Swati / Swazi |
| Official languages | |
| English | |
| siSwati | |
| Ethnic groups | |
| predominantly Swazi small populations of other African ethnic groups, including the Zulu, and people of European ancestry | |
| Religions (2015) | |
| Christian | 90% |
| Zionist – a blend of Christianity and indigenous ancestral worship | 40% |
| Roman Catholic | 20% |
| other | 30% |
| Muslim | 2% |
| other | 8% |
| Life expectancy (2020) | |
| Male | 56.5 years |
| Female | 60.7 years |
| Total population | 58.6 years (220th) |
| Homicides | |
| Total (2017) | 11.6 per 100,000 people (28th) |
| Geography | |
| Land area | 17,204 km2 |
| water area | 160 km2 |
| total area | 17,364 km2 (159th) |
| Mean elevation | 305 m |
| Lowest point | |
| Great Usutu River | 21 m |
| Highest point | |
| Emlembe | 1,862 m |
| Land use (2011) | |
| Agricultural land | 68.3% |
| Arable land | 9.8% |
| Permanent crops | 0.8% |
| Permanent pasture | 57.7% |
| Forest | 31.7% |
| Other | 0% |
| Urbanization | |
| Urban population (2020) | 24.2% |
| Rate of urbanization | 2.46% annual rate of change (2015 – 2020) |
| Economy | |
| Labor force (2016) | 427,900 (157th) |
| Labor force by occupation (2014) | |
| Agriculture | 10.7% |
| Industry | 30.4% |
| Services | 58.9% |
| Unemployment rate (2014) | 28% (203rd) |
| GDP (PPP) (estimate 2019) | |
| Total | $12.293 billion |
| Per capita | $11,089 |
| GDP (nominal) (estimate 2019) | |
| Total | $4.662 billion |
| Per capita | $4,146 |
| GDP by sector (estimate 2017) | |
| Agriculture | 6.5% |
| Industry | 45% |
| Services | 48.6% |
| Exports (2017) | $1.83 billion (145th) |
| Exports partners (2017) | |
| South Africa | 94% |
| Imports (2017) | $1.451 billion (175th) |
| Imports partners (2017) | |
| South Africa | 81.6% |
| China | 5.2% |
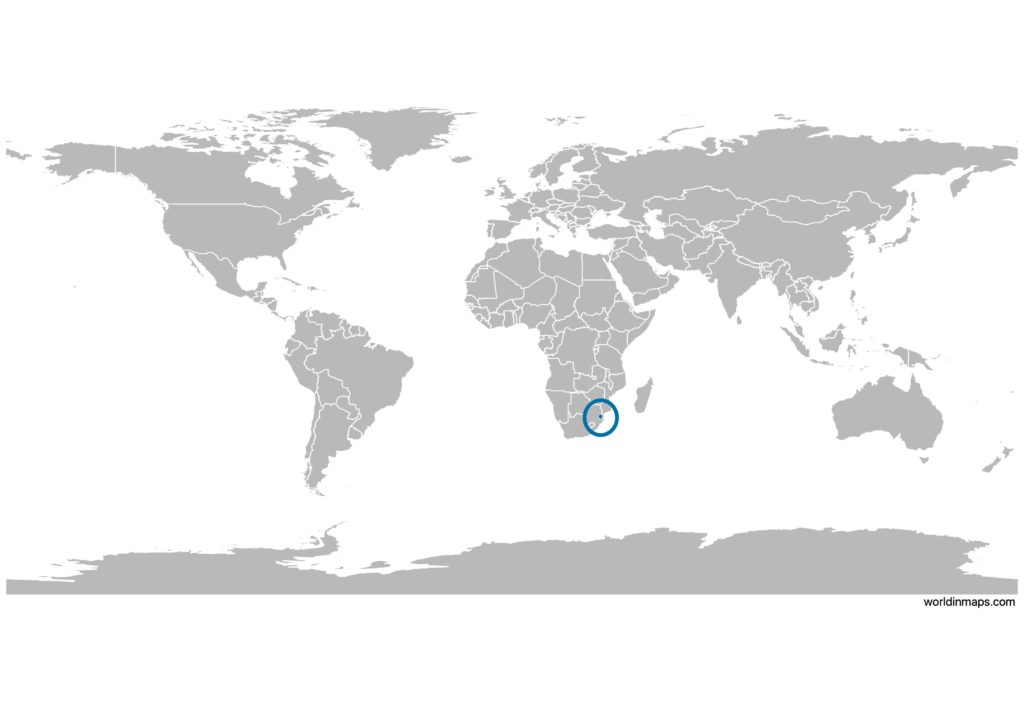
Eswatini (Swaziland) on the world map
Eswatini (Swaziland) top 10 largest cities (2005)
- Manzini (110,537)
- Mbabane (76,218)
- Big Bend (10,342)
- Malkerns (9,724)
- Nhlangano (9,016)
- Mhlume (8,652)
- Hluti (6,763)
- Simunye (6,512)
- Siteki (6,152)
- Piggs Peak (5,750)
Demography
Population pyramid
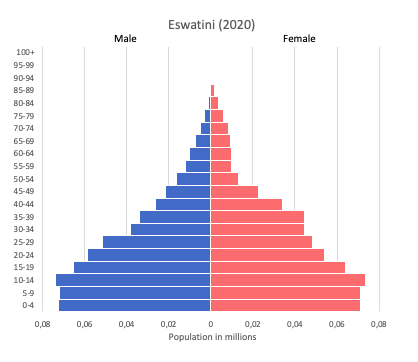
Age structure data
Estimate for 2020:
- 0-14 years: 33.63% (male 185,640/female 185,808)
- 15-24 years: 18.71% (male 98,029/female 108,654)
- 25-54 years: 39.46% (male 202,536/female 233,275)
- 55-64 years: 4.36% (male 20,529/female 27,672)
- 65 years and over: 3.83% (male 15,833/female 26,503)
Remark: the age structure of a population affects a nation’s key socioeconomic issues. Countries with young populations (high percentage under age 15) need to invest more in schools, while countries with older populations (high percentage ages 65 and over) need to invest more in the health sector. The age structure can also be used to help predict potential political issues. For example, the rapid growth of a young adult population unable to find employment can lead to unrest.
Population from 1950 to 2020
Source: United Nations, Department of Economic and Social Affairs, Population Division (2019). World Population Prospects 2019, Online Edition. Rev. 1.
Evolution of the life expectancy from 1960 to 2018
Source: World Development Indicators, The World Bank
Economy
Agriculture:
sugarcane, corn, cotton, citrus, pineapples, cattle, goats
Industries:
soft drink concentrates, coal, forestry, sugar processing, textiles, and apparel
Exports – commodities:
soft drink concentrates, sugar, timber, cotton yarn, refrigerators, citrus, and canned fruit
Imports – commodities:
motor vehicles, machinery, transport equipment, foodstuffs, petroleum products, chemicals
Time zone and current time in Eswatini (Swaziland)
Go to our interactive map to get the current time in Eswatini (Swaziland)