Antigua and Barbuda
| Government | |
| Name | Antigua and Barbuda |
| Government type | Parliamentary democracy under a constitutional monarchy (a Commonwealth realm) |
| Capital | Saint John’s (21,000 (2018)) |
| Currency | East Caribbean dollar (XCD) |
| Organization | |
| Member State | Commonwealth of Nations |
| People | |
| Population (2020) | 97,928 (199th) |
| Density of population | 186 P/km2 |
| Nationality | Antiguan, Barbudan |
| Official languages | |
| English | |
| Ethnic groups (2011) | |
| African descent | 87.3% |
| Mixed | 4.7% |
| Hispanic | 2.7% |
| White | 1.6% |
| Other | 2.7% |
| Unspecified | 0.9% |
| Religion (2011) | |
| Protestant | 68.3% |
| Anglican | 17.6% |
| Seventh Day Adventist | 12.4% |
| Pentecostal | 12.2% |
| Moravian | 8.3% |
| Methodist | 5.6% |
| Wesleyan Holiness | 4.5% |
| Church of God | 4.1% |
| Baptist | 3.6% |
| Roman Catholic | 8.2% |
| Other | 12.2% |
| Unspecified | 5.5% |
| None | 5.9% |
| Life expectancy (2020) | |
| Male | 75.1 years |
| Female | 79.6 years |
| Total population | 77.3 years (83th) |
| Homicides | |
| Total (2012) | 11.1 per 100,000 people (31st) |
| Literacy (2015) | |
| Definition: age 15 and over can read and write | |
| Male | 98.4% |
| Female | 99.4% |
| Total population | 99% |
| Geography | |
| Land area | 442.6 km2 (Antigua 280 km2 ; Barbuda 161 km2 ; Redonda: 1.6 km2) |
| water area | 0 km2 |
| total area | 442.6 km2 (201st) |
| Lowest point | |
| Caribbean Sea | 0 m |
| Highest point | |
| Mount Obama | 402 m |
| Land use (2016) | |
| Agricultural land | 20.5% |
| Arable land | 9.1% |
| Permanent crops | 2.3% |
| Permanent pasture | 9.1% |
| Forest | 22.3% |
| Other | 57.3% |
| Urbanization | |
| Urban population (2020) | 24.4% |
| Rate of urbanization | 0.55% annual rate of change (2015 – 2020) |
| Economy | |
| Labor force (1991) | 30,000 (204st) |
| Agriculture | 7% |
| Industry | 11% |
| Services (1983 estimate) | 82% |
| Unemployment rate (2014) | 11% (148th) |
| GDP (PPP) (estimate 2019) | |
| Total | $2.731 billion |
| Per capita | $29,298 |
| GDP (nominal) (estimate 2019) | |
| Total | $1.717billion |
| Per capita | $18,416 |
| GDP by sector (estimate 2017) | |
| Agriculture | 1.8% |
| Industry | 20.8% |
| Services | 77.3% |
| Exports (2017) | $86.7 million (59th) |
| Exports partners (2017) | |
| Poland | 62.2% |
| Cameroon | 9.5% |
| US | 5.1% |
| UK | 4.5% |
| Imports (2017) | $560 million (198th) |
| Exports partners (2017) | |
| US | 48% |
| Spain | 4.2% |
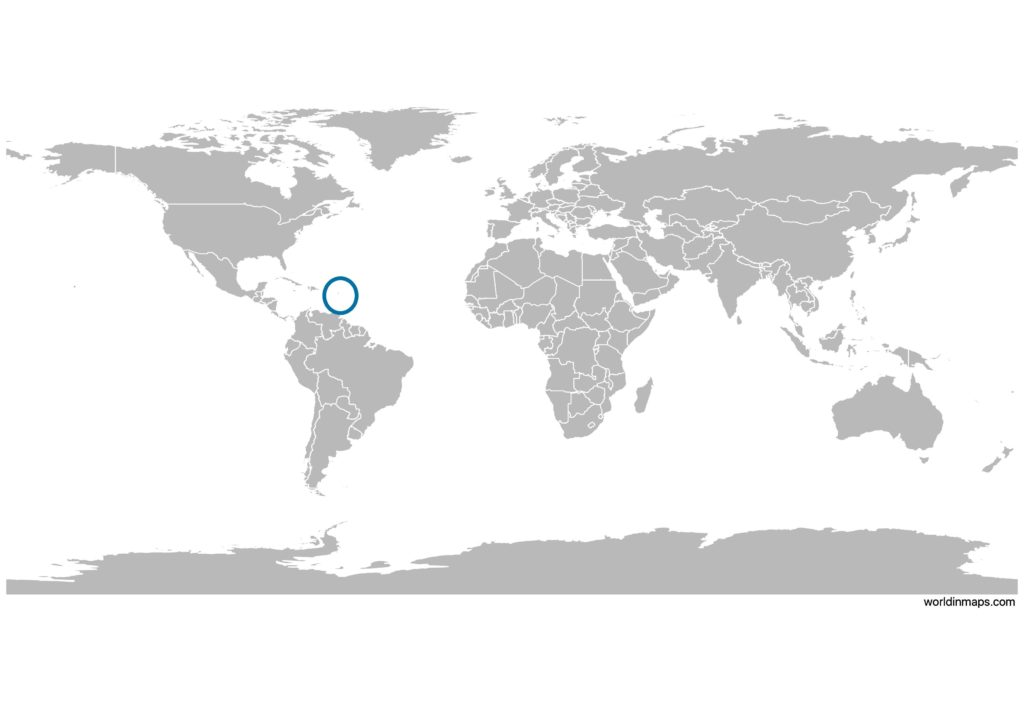
Antigua and Barbuda on the world map
Demography
Population pyramid data of Antigua and Barbuda
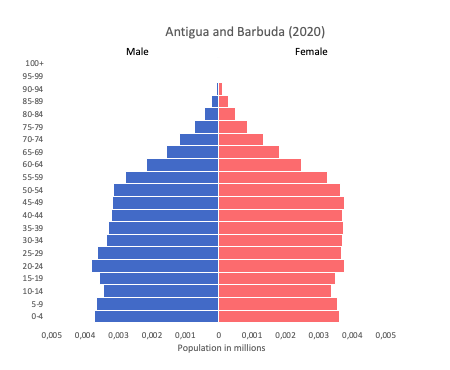
Age structure of Antigua and Barbuda
Estimate for 2020:
- 0-14 years: 22.52% (male 11,243/female 10,871)
- 15-24 years: 16.15% (male 7,891/female 7,961)
- 25-54 years: 41.68% (male 18,757/female 22,167)
- 55-64 years: 10.74% (male 4,693/female 5,848)
- 65 years and over: 8.91% (male 3,736/female 5,012)
Remark: the age structure of a population affects a nation’s key socioeconomic issues. Countries with young populations (high percentage under age 15) need to invest more in schools, while countries with older populations (high percentage ages 65 and over) need to invest more in the health sector. The age structure can also be used to help predict potential political issues. For example, the rapid growth of a young adult population unable to find employment can lead to unrest.
Population from 1950 to 2020
Source: United Nations, Department of Economic and Social Affairs, Population Division (2019). World Population Prospects 2019, Online Edition. Rev. 1.
Evolution of the life expectancy from 1960 to 2018
Source: World Development Indicators, The World Bank
Economy
Agriculture:
cotton, fruits, vegetables, bananas, coconuts, cucumbers, mangoes, sugarcane, livestock
Industries:
tourism, construction, light manufacturing (clothing, alcohol, household appliances)
Exports – commodities:
petroleum products, bedding, handicrafts, electronic components, transport equipment, food and live animals
Imports – commodities:
food and live animals, machinery and transport equipment, manufactures, chemicals, oil
Time in Antigua and Barbuda:
Go to our interactive map to get the current time in Antigua