United States (US)

| Government | |
| Name | United States of America |
| Government type | constitutional federal republic |
| Capital | Washington, D.C. (705,749 (2019)) |
| Currency | United States dollar (USD) |
| Organization | |
| Observer State | South Asian Association for Regional Cooperation (SAARC) |
| People | |
| Population (2020) | 331,002,647 (3rd) |
| Density of population | 87 P/km2 (146th) |
| Nationality | American |
| Official languages | |
| no official national language, but English has acquired official status in 32 of the 50 states | |
| Ethnic groups (2010) | |
| white | 72.4% |
| black | 12.6% |
| Asian | 4.8% |
| Amerindian and Alaska native | 0.9% |
| native Hawaiian and other Pacific islander | 0.2% |
| other | 6.2% |
| Multiracial | 2.9% |
| There is no separate listing for Hispanic, but 16.3% of the total US population is estimated to be Hispanic. | |
| Religions (2014) | |
| Protestant | 46.5% |
| Roman Catholic | 20.8% |
| Jewish | 1.9% |
| Mormon | 1.6% |
| other Christian | 0.9% |
| Muslim | 0.9% |
| Jehovah’s Witness | 0.8% |
| Buddhist | 0.7% |
| Hindu | 0.7% |
| other | 1.8% |
| unaffiliated | 22.8% |
| don’t know / refused | 0.6% |
| Life expectancy (2020) | |
| Male | 78 years |
| Female | 82.5 years |
| Total population | 80.3 years (45th) |
| Homicides | |
| Total (2018) | 5.0 per 100,000 people (64th) |
| Geography | |
| Land area | 9,147,593 km2 |
| water area | 685,924 km2 |
| total area | 9,833,517 km2 (4th) |
| note: includes no overseas territories | |
| Mean elevation | 760 m |
| Lowest point | |
| Death Valley (lowest point in North America) | -86 m |
| Highest point | |
| Denali (Mount McKinley) (highest point in North America) | 6,190 m |
| note: the peak of the Mauna Kea volcano (4,207 m above sea level) on the island of Hawaii rises about 10,200 m above the Pacific Ocean floor. It is the world’s tallest mountain. It is higher than the Mount Everest (8,850 m), which is the tallest mountain above sea level. | |
| Land use (2011) | |
| Agricultural land | 44.5% |
| Arable land | 16.8% |
| Permanent crops | 0.3% |
| Permanent pasture | 27.4% |
| Forest | 33.3% |
| Other | 22.2% |
| Urbanization | |
| Urban population (2020) | 82.7% |
| Rate of urbanization | 0.95% annual rate of change (2015 – 2020) |
| Economy | |
| Labor force (2017) | 160.4 million (3rd) |
| Labor force by occupation (2009) | |
| Agriculture | 0.7% |
| Industry | 20.3% |
| Services | 79% |
| Unemployment rate (2017) | 4.4% (62nd) |
| GDP (PPP) (estimate 2020) | |
| Total | $22.321 trillion (2nd) |
| Per capita | $67,426 (11th) |
| GDP (nominal) (estimate 2020) | |
| Total | $22.321 trillion (1st) |
| Per capita | $67,426 (7th) |
| GDP by sector (estimate 2017) | |
| Agriculture | 0.9% |
| Industry | 19.1% |
| Services | 80% |
| Exports (2017) | $1.553 trillion (2nd) |
| Exports partners (2017) | |
| Canada | 18.3% |
| Mexico | 15.7% |
| China | 8.4% |
| Japan | 4.4% |
| Imports (2017) | $2.361 trillion (1st) |
| Imports partners (2017) | |
| China | 21.6% |
| Mexico | 13.4% |
| Canada | 12.8% |
| Japan | 5.8% |
| Germany | 5% |
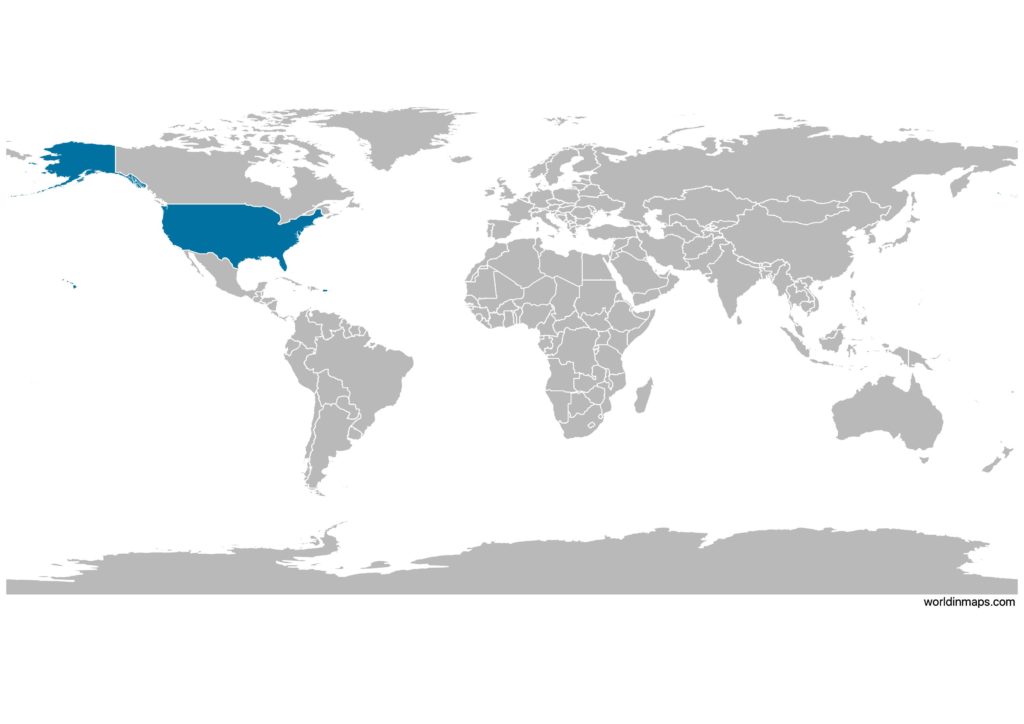
United States (US) on the world map
United States (US) top 10 largest cities (2019)
- New York (8,336,817)
- Los Angeles (3,979,576)
- Chicago (2,693,976)
- Houston (2,320,268)
- Phoenix (1,680,992)
- Philadelphia (1,584,064)
- San Antonio (1,547,253)
- San Diego (1,423,851)
- Dallas (1,343,573)
- San Jose (1,021,795)
Demography
Population pyramid
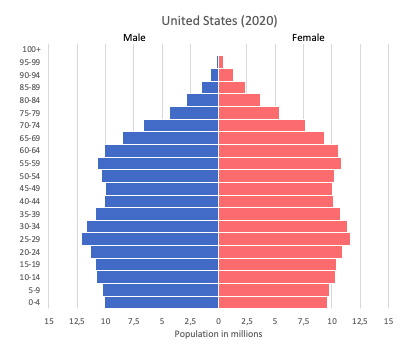
Age structure data
Estimate for 2020:
- 0-14 years: 18.46% (male 31,374,555/female 30,034,371)
- 15-24 years: 12.91% (male 21,931,368/female 21,006,463)
- 25-54 years: 38.92% (male 64,893,670/female 64,564,565)
- 55-64 years: 12.86% (male 20,690,736/female 22,091,808)
- 65 years and over: 16.85% (male 25,014,147/female 31,037,419)
Remark: the age structure of a population affects a nation’s key socioeconomic issues. Countries with young populations (high percentage under age 15) need to invest more in schools, while countries with older populations (high percentage ages 65 and over) need to invest more in the health sector. The age structure can also be used to help predict potential political issues. For example, the rapid growth of a young adult population unable to find employment can lead to unrest.
Population from 1950 to 2020
Source: United Nations, Department of Economic and Social Affairs, Population Division (2019). World Population Prospects 2019, Online Edition. Rev. 1.
Evolution of the life expectancy from 1960 to 2018
Source: World Development Indicators, The World Bank
Major rivers
- Missouri River (3,768 km / 2,341 mi)
- Mississippi River (3,544 km / 2,202 mi)
- Yukon River (3,185 km / 1,979 mi)
- Rio Grande (2,830 km / 1,759 mi)
- Colorado River (2,330 km / 1,450 mi)
- Arkansas River (2,322 km / 1,443 mi)
- Columbia River (2,000 km / 1,243 mi)
- Red River (1,811 km / 1,125 mi)
- Snake River (1,674 km / 1,040 mi)
- Ohio River (1,579 km / 981 mi)
Economy
Agriculture:
wheat, corn, other grains, fruits, vegetables, cotton; beef, pork, poultry, dairy products; fish; forest products
Industries:
highly diversified, world leading, high-technology innovator, second-largest industrial output in the world; petroleum, steel, motor vehicles, aerospace, telecommunications, chemicals, electronics, food processing, consumer goods, lumber, mining
Exports – commodities (2008):
agricultural products (soybeans, fruit, corn) 9.2%, industrial supplies (organic chemicals) 26.8%, capital goods (transistors, aircraft, motor vehicle parts, computers, telecommunications equipment) 49.0%, consumer goods (automobiles, medicines) 15.0%
Imports – commodities (2008):
agricultural products 4.9%, industrial supplies 32.9% (crude oil 8.2%), capital goods 30.4% (computers, telecommunications equipment, motor vehicle parts, office machines, electric power machinery), consumer goods 31.8% (automobiles, clothing, medicines, furniture, toys)
Time zone and current time in the US
Go to our interactive map to get the current time in the US.
History
The 13 colonies (1607 – 1776)
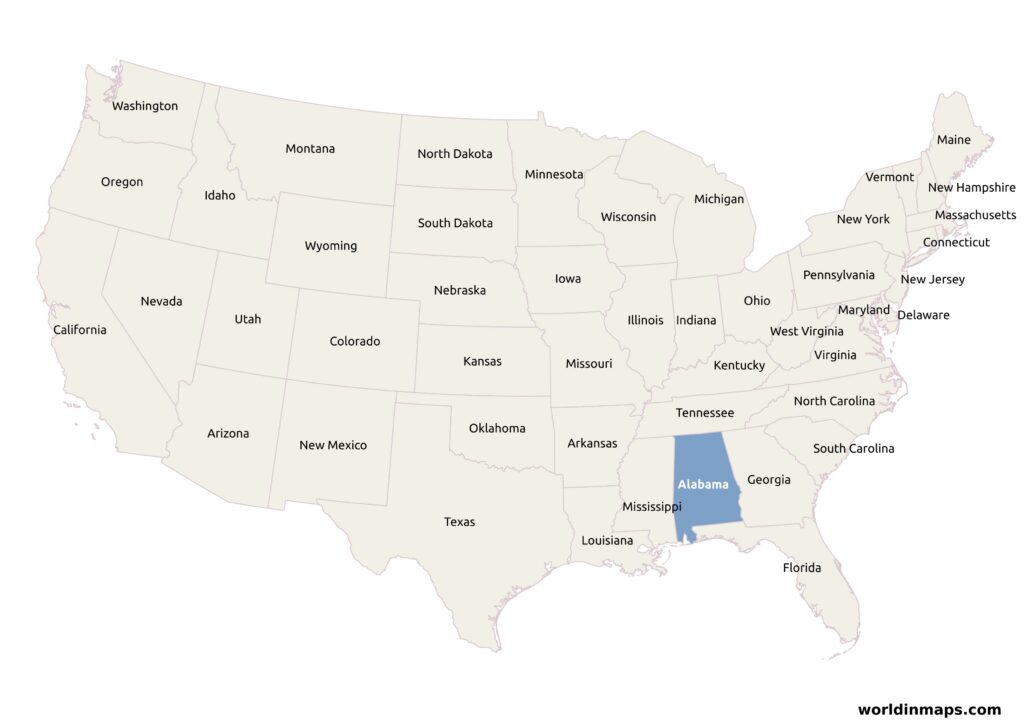
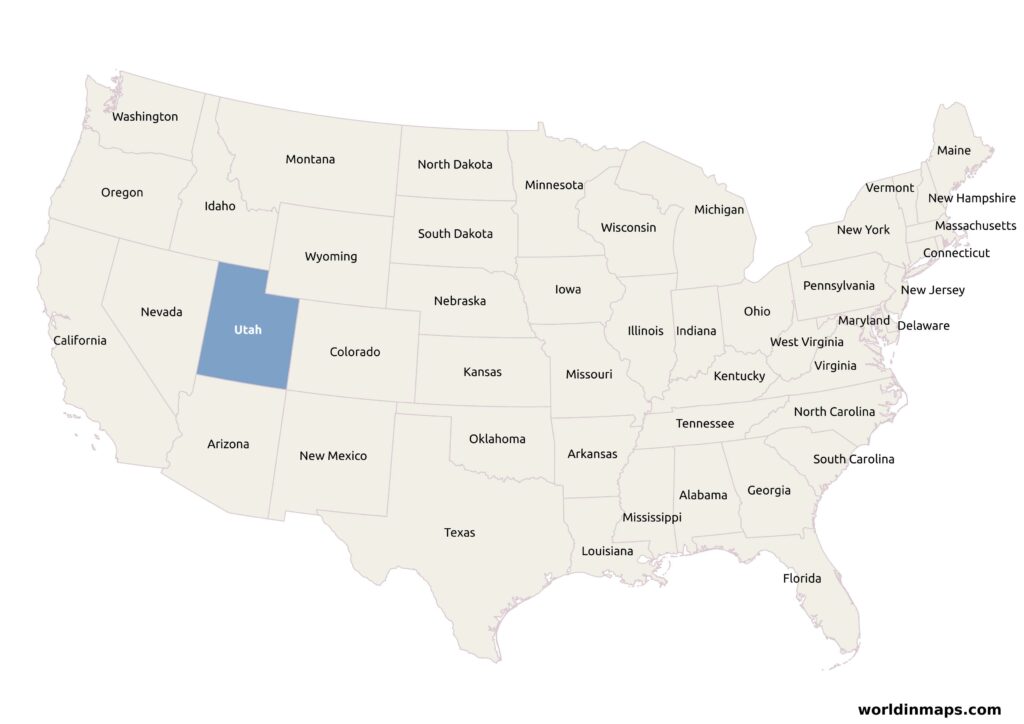
States
More states are coming