Cameroon
| Government | |
| Name | Republic of Cameroon |
| French | République du Cameroun |
| Fula | Renndaandi Kamerun |
| Government type | Presidential republic |
| Capital | Yaoundé (1,817,524 (2005)) |
| Currency | Central African CFA (XAF) |
| Organization | |
| Member State | Commonwealth of Nations |
| People | |
| Population (2020) | 26,545,864 (51st) |
| Density of population | 39.7 P/km2 (167th) |
| Nationality | Cameroonian |
| Official languages | |
| English | |
| French | |
| Ethnic groups | |
| Cameroon Highlanders | 31% |
| Equatorial Bantu | 19% |
| Kirdi | 11% |
| Fulani | 10% |
| Northwestern Bantu | 8% |
| Eastern Nigritic | 7% |
| Other African | 13% |
| Non-African | <1% |
| Religions (2005) | |
| Roman Catholic | 38.4% |
| Protestant | 26.3% |
| Other Christian | 4.5% |
| Muslim | 20.9% |
| Animist | 5.6% |
| Other | 1% |
| Non-believer | 3.2% |
| Life expectancy (2020) | |
| Male | 60.6 years |
| Female | 64 years |
| Total population | 62.3 years (209th) |
| Homicides | |
| Total (2017) | 1.4 per 100,000 people (121st) |
| Geography | |
| Land area | 472,710 km2 |
| water area | 2,730 km2 |
| total area | 475,440 km2 (55th) |
| Mean elevation | 667 m |
| Lowest point | |
| Atlantic Ocean | 0 m |
| Highest point | |
| Fako on Mont Cameroun | 4,045 m |
| Land use (2011) | |
| Agricultural land | 20.6% |
| Arable land | 13.1% |
| Permanent crops | 3.3% |
| Permanent pasture | 4.2% |
| Forest | 41.7% |
| Other | 37.7% |
| Urbanization | |
| Urban population (2020) | 57.6% |
| Rate of urbanization | 3.63% annual rate of change (2015 – 2020) |
| Economy | |
| Labor force (2017) | 9.912 million (52nd) |
| Labor force by occupation (2001) | |
| Agriculture | 70% |
| Industry | 13% |
| Services | 17% |
| Unemployment rate (2014) | 4.3% (57th) |
| GDP (PPP) (estimate 2018) | |
| Total | $95.068 billion (93rd) |
| Per capita | $3,820(152nd) |
| GDP (nominal) (estimate 2018) | |
| Total | $38.445 billion (98th) |
| Per capita | $1,544 (152nd) |
| GDP by sector (estimate 2017) | |
| Agriculture | 16.7% |
| Industry | 26.5% |
| Services | 56.8% |
| Exports (2017) | $4.732 billion (109th) |
| Exports partners (2017) | |
| Netherlands | 15.6% |
| France | 12.6% |
| China | 11.7% |
| Belgium | 6.8% |
| Italy | 6.3% |
| Algeria | 4.8% |
| Malaysia | 4.4 |
| Imports (2017) | $4.812 billion (132nd) |
| Imports partners (2017) | |
| China | 19% |
| France | 10.3% |
| Thailand | 7.9% |
| Nigeria | 4.1% |
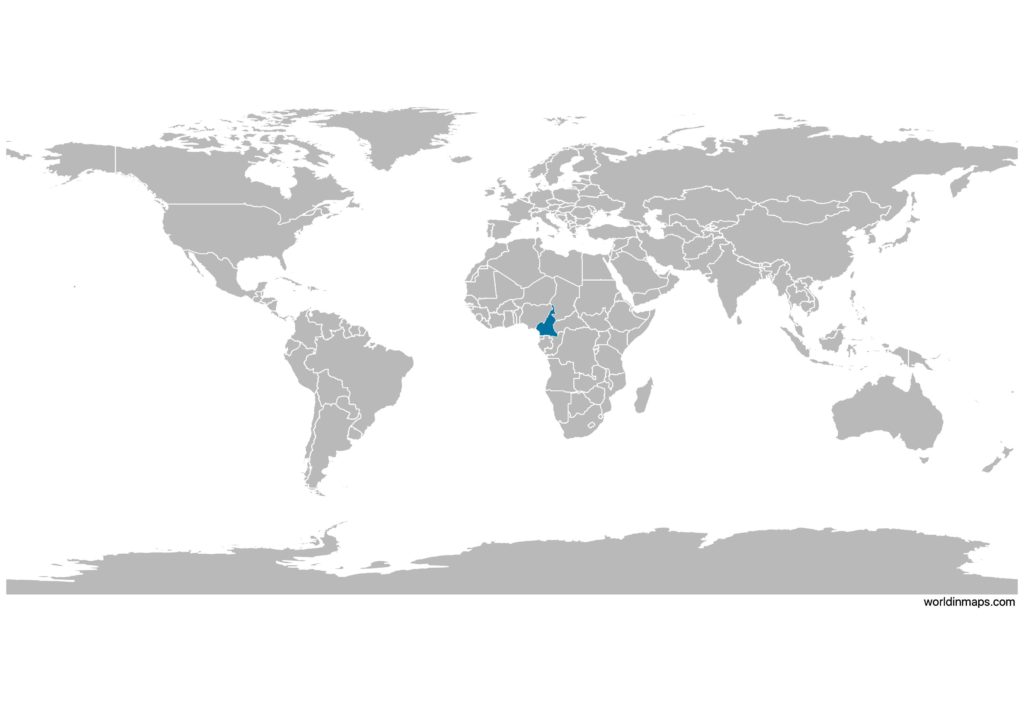
Cameroon on the world map
Cameroon top 10 largest cities (2005)
- Douala (1,906,962)
- Yaoundé (1,817,524)
- Bafoussam (800,000)
- Bamenda (269,530)
- Garoua (235,996)
- Maroua (201,371)
- Ngaoundéré (152,698)
- Kumba (144,268)
- Nkongsamba (104,050)
- Buea (90,090)
Demography
Population pyramid
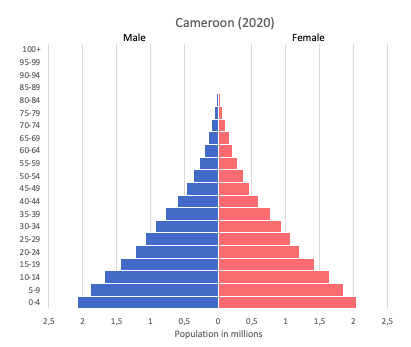
Age structure data
Estimate for 2020:
- 0-14 years: 42.34% (male 5,927,640/female 5,820,226)
- 15-24 years: 20.04% (male 2,782,376/female 2,776,873)
- 25-54 years: 30.64% (male 4,191,151/female 4,309,483)
- 55-64 years: 3.87% (male 520,771/female 552,801)
- 65 years and over: 3.11% (male 403,420/female 460,248)
Remark: the age structure of a population affects a nation’s key socioeconomic issues. Countries with young populations (high percentage under age 15) need to invest more in schools, while countries with older populations (high percentage ages 65 and over) need to invest more in the health sector. The age structure can also be used to help predict potential political issues. For example, the rapid growth of a young adult population unable to find employment can lead to unrest.
Population from 1950 to 2020
Source: United Nations, Department of Economic and Social Affairs, Population Division (2019). World Population Prospects 2019, Online Edition. Rev. 1.
Evolution of the life expectancy from 1960 to 2018
Source: World Development Indicators, The World Bank
Economy
Agriculture:
coffee, cocoa, cotton, rubber, bananas, oilseed, grains, cassava (manioc, tapioca), livestock, timber
Industries:
petroleum production and refining, aluminum production, food processing, light consumer goods, textiles, lumber, ship repair
Exports – commodities:
crude oil and petroleum products, lumber, cocoa beans, aluminum, coffee, cotton
Imports – commodities:
machinery, electrical equipment, transport equipment, fuel, food
Time zone and current time in Cameroon
Go to our interactive map to get the current time in Cameroon