Bahamas
| Government | |
| Name | Commonwealth of The Bahamas |
| Government type | parliamentary democracy under a constitutional monarchy (a Commonwealth realm) |
| Capital | Nassau (172,196 (2009)) |
| Currency | Bahamian dollar (BSD) |
| Organization | |
| Member State | Commonwealth of Nations |
| People | |
| Population (2020) | 393,248 (177th) |
| Density of population | 25,21 P/km2 (181st) |
| Nationality | Bahamian |
| Official languages | |
| English | |
| Ethnic groups (2010) | |
| Afro-Bahamian | 90.6% |
| European | 4.7% |
| Mulatto | 2.1% |
| Other | 1.9% |
| Unspecified | 0.7% |
| Religion (2010) | |
| Protestant | 69.9% |
| Baptist | 34.9% |
| Anglican | 13.7% |
| Pentecostal | 8.9% |
| Seventh Day Adventist | <4.4% |
| Methodist | 3.6% |
| Church of God | 1.9% |
| Brethren | 1.6% |
| Other Protestant | 0.9% |
| Roman Catholic | 12% |
| Other Christian | 13% |
| Jehovah’s Witness | 1.1% |
| Other | 0.6% |
| None | 1.9% |
| Unspecified | 2.6% |
| Life expectancy (2020) | |
| Male | 70.8 years |
| Female | 75.8 years |
| Total population | 73.3 years (146th) |
| Homicides | |
| Total (2017) | 32.0 per 100,000 people (11th) |
| Geography | |
| Land area | 10,010 km2 |
| water area | 3,870 km2 |
| total area | 13,880 km2 (114th) |
| Lowest point | |
| Atlantic Ocean | 0 m |
| Highest point | |
| Mount Alvernia | 64 m |
| Land use (2016) | |
| Agricultural land | 1.4% |
| Arable land | 0.8% |
| Permanent crops | 0.4% |
| Permanent pasture | 0.2% |
| Forest | 51.4% |
| Other | 47.2% |
| Urbanization | |
| Urban population (2020) | 83.2% |
| Rate of urbanization | 1.13% annual rate of change (2015 – 2020) |
| Economy | |
| Labor force (2013) | 196,900 (173rd) |
| Agriculture | 3% |
| Industry | 11% |
| Services | 49% |
| Tourism | 37% |
| Unemployment rate (2017) | 10.1% (140th) |
| GDP (PPP) (estimate 2018) | |
| Total | $12.612 billion |
| Per capita | $33,494 |
| GDP (nominal) (estimate 2018) | |
| Total | $12.803 billion |
| Per capita | $34,002 |
| GDP by sector (estimate 2017) | |
| Agriculture | 2.3% |
| Industry | 7.7% |
| Services | 90% |
| Exports (2017) | $550 million (174th) |
| Exports partners (2017) | |
| US | 63.9% |
| Namibia | 19.3% |
| Imports (2017) | $3.18 billion (146th) |
| Imports partners (2017) | |
| US | 83.2% |
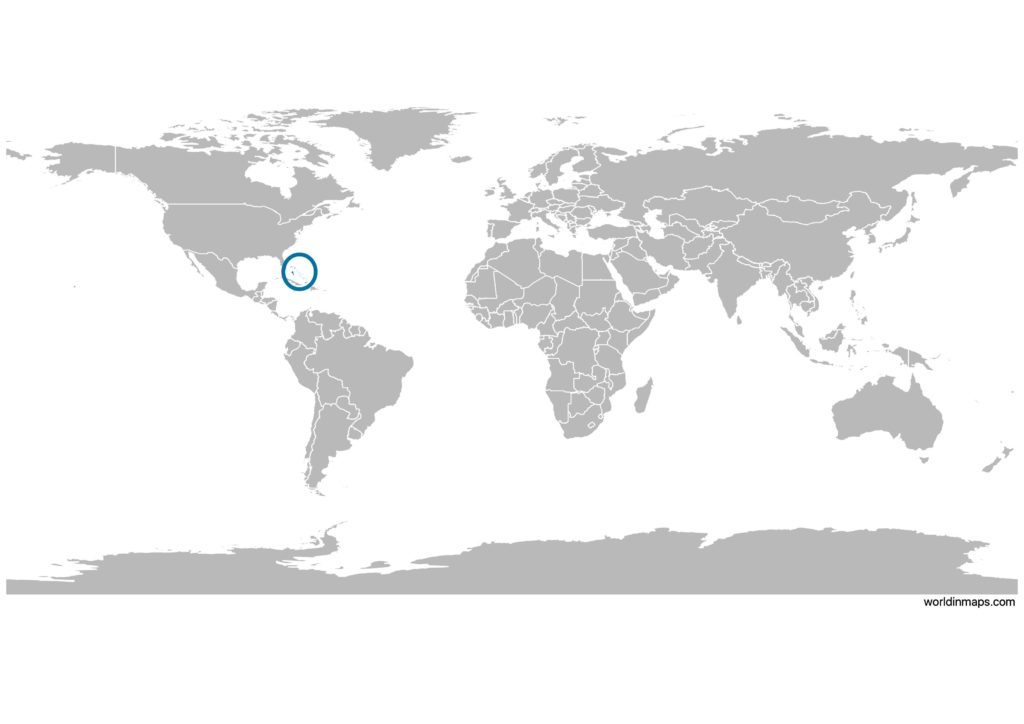
The Bahamas on the world map
Demography
Population pyramid
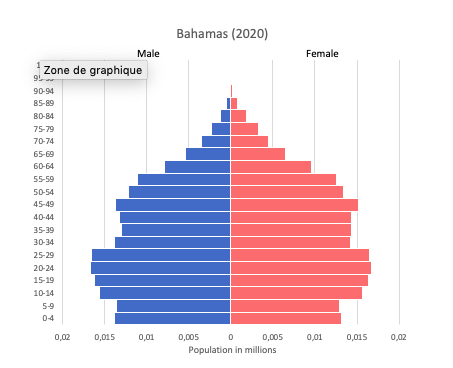
Age structure data
Estimate for 2020:
- 0-14 years: 22.04% (male 37,758/female 36,668)
- 15-24 years: 15.39% (male 26,332/female 25,650)
- 25-54 years: 43.86% (male 74,485/female 73,647)
- 55-64 years: 10.04% (male 15,648/female 18,250)
- 65 years and over: 8.67% (male 11,326/female 17,957)
Remark: the age structure of a population affects a nation’s key socioeconomic issues. Countries with young populations (high percentage under age 15) need to invest more in schools, while countries with older populations (high percentage ages 65 and over) need to invest more in the health sector. The age structure can also be used to help predict potential political issues. For example, the rapid growth of a young adult population unable to find employment can lead to unrest.
Population from 1950 to 2020
Source: United Nations, Department of Economic and Social Affairs, Population Division (2019). World Population Prospects 2019, Online Edition. Rev. 1.
Economy
Agriculture:
citrus, vegetables, poultry, seafood
Industries:
tourism, banking, oil bunkering, maritime industries, transshipment and logistics, salt, aragonite, pharmaceuticals
Exports – commodities:
Rock lobster, aragonite, crude salt, polystyrene products
Imports – commodities:
machinery and transport equipment, manufactures, chemicals, mineral fuels, food and live animals
Time zone and current time in The Bahamas
Go to our interactive map to get the current time in The Bahamas