Namibia
| Government | |
| Name | Republic of Namibia |
| Government type | presidential republic |
| Capital | Windhoek (325,858 (2011)) |
| Currency | Namibian dollar (NAD) South African rand (ZAR) |
| Organization | |
| Member State | Commonwealth of Nations |
| People | |
| Population (2020) | 2,540,916 (143rd) |
| Density of population | 3.2 P/km2 (235th) |
| Nationality | Namibian |
| Official languages | |
| English | |
| Ethnic groups | |
| Ovambo | 50% |
| Kavangos | 9% |
| Herero | 7% |
| Damara | 7% |
| Mixed European and African ancestry | 6.5% |
| European | 6% |
| Nama | 5% |
| Caprivian | 4% |
| San | 3% |
| Baster | 2% |
| Tswana | .5% |
| Religions | |
| Christian (> 50% Lutheran) | 80% – 90% |
| Indigenous beliefs | 10% – 20% |
| Life expectancy (2020) | |
| Male | 63.3 years |
| Female | 67.3 years |
| Total population | 65.3 years (195th) |
| Homicides | |
| Total (2012) | 17.7 per 100,000 people (22nd) |
| Geography | |
| Land area | 823,290 km2 |
| water area | 1,002 km2 |
| total area | 824,292 km2 (35th) |
| Mean elevation | 1,141 m |
| Lowest point | |
| Atlantic Ocean | 0 m |
| Highest point | |
| Konigstein on Brandberg | 2,573 m |
| Land use (2011) | |
| Agricultural land | 47.2% |
| Arable land | 1% |
| Permanent crops | 0% |
| Permanent pasture | 46.2% |
| Forest | 8.8% |
| Other | 44% |
| Urbanization | |
| Urban population (2020) | 52% |
| Rate of urbanization | 4.2% annual rate of change (2015 – 2020) |
| Economy | |
| Labor force (2017) | 956,800 million (146th) |
| Labor force by occupation (2013) | |
| Agriculture | 31% |
| Industry | 14% |
| Services | 54% |
| Unemployment rate (2016) | 34% (210th) |
| GDP (PPP) (estimate 2018) | |
| Total | $27.505 billion |
| Per capita | $11,516 |
| GDP (nominal) (estimate 2018) | |
| Total | $14.148 billion |
| Per capita | $5,923 |
| GDP by sector (estimate 2016) | |
| Agriculture | 6.7% |
| Industry | 26.3% |
| Services | 67% |
| Exports (2017) | $3.995 billion (117th) |
| Exports partners (2017) | |
| South Africa | 27.1% |
| Botswana | 14.9% |
| Switzerland | 12% |
| Zambia | 5.7% |
| China | 4.6% |
| Italy | 4.4% |
| Imports (2017) | $5.384 billion (123rd) |
| Imports partners (2017) | |
| South Africa | 61.4% |
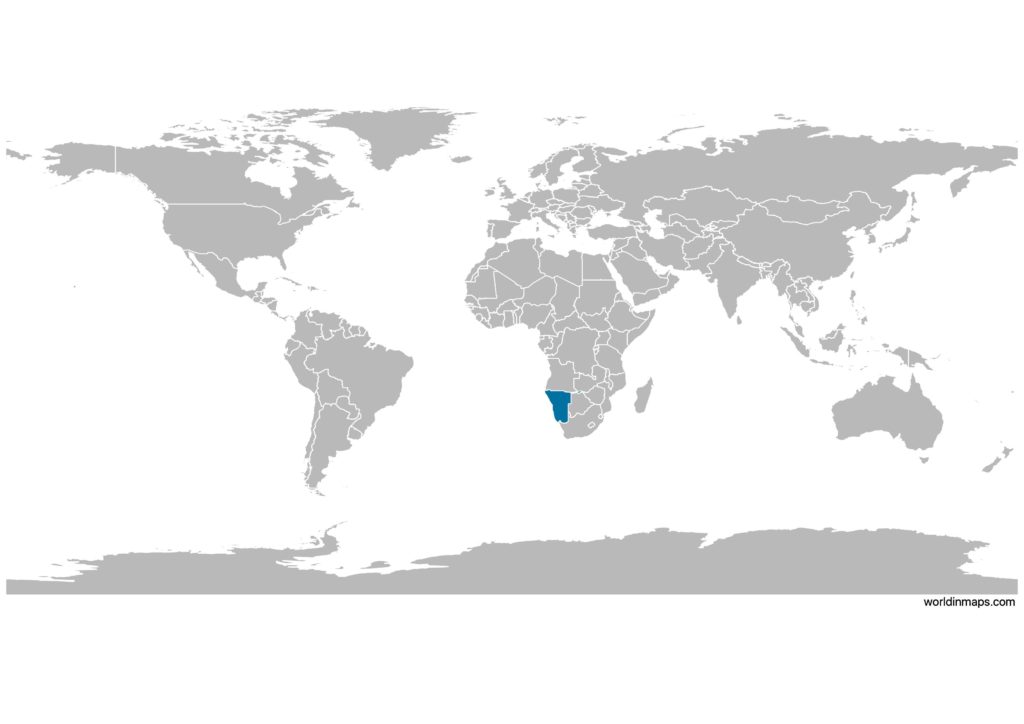
Namibia on the world map
Namibia top 10 largest cities (2011)
- Windhoek (325,858)
- Rundu (63,431)
- Walvis Bay (62,096)
- Swakopmund (44,725)
- Oshakati (36,541)
- Rehoboth (28,843)
- Katima Mulilo (28,362)
- Otjiwarongo (28,249)
- Ondangwa (22,822)
- Okahandja (22,639)
Demography
Population pyramid
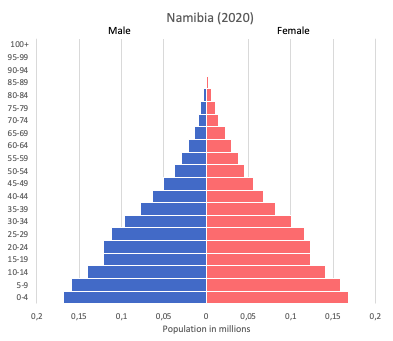
Age structure data
Estimate for 2020:
- 0-14 years: 35.68% (male 473,937/female 464,453)
- 15-24 years: 20.27% (male 267,106/female 265,882)
- 25-54 years: 35.47% (male 449,132/female 483,811)
- 55-64 years: 4.68% (male 54,589/female 68,619)
- 65 years and over: 3.9% (male 43,596/female 58,948)
Remark: the age structure of a population affects a nation’s key socioeconomic issues. Countries with young populations (high percentage under age 15) need to invest more in schools, while countries with older populations (high percentage ages 65 and over) need to invest more in the health sector. The age structure can also be used to help predict potential political issues. For example, the rapid growth of a young adult population unable to find employment can lead to unrest.
Population from 1950 to 2020
Source: United Nations, Department of Economic and Social Affairs, Population Division (2019). World Population Prospects 2019, Online Edition. Rev. 1.
Evolution of the life expectancy from 1960 to 2018
Source: World Development Indicators, The World Bank
Major rivers
Economy
Agriculture:
millet, sorghum, peanuts, grapes, livestock, fish
Industries:
meatpacking, fish processing, dairy products, pasta, beverages, mining (diamonds, lead, zinc, tin, silver, tungsten, uranium, copper)
Exports – commodities:
diamonds, copper, gold, zinc, lead, uranium, cattle, white fish and mollusks
Imports – commodities:
foodstuffs, petroleum products and fuel, machinery and equipment, chemicals
Time zone and current time in Namibia
Go to our interactive map to get the current time in Namibia