Cape Verde (or Cabo Verde)
| Government | |
| Name | Republic of Cabo Verde |
| Portuguese | República de Cabo Verde |
| Cape Verdaan Creole | Repúblika di Kabu Verdi |
| Government type | Parliamentary republic |
| Capital | Praia (127,832 (2010)) |
| Currency | Cape Verdean escudo (CVE) |
| People | |
| Population (2020) | 555,988 (172nd) |
| Density of population | 123.7 P/km2 (89th) |
| Nationality | Cabo Verdean |
| Official languages | |
| Portuguese | |
| Ethnic groups (2012) | |
| Creole (mulatto) | 71% |
| African | 28% |
| European | 1% |
| Religions (2010) | |
| Roman Catholic | 77.3% |
| Protestant | 4.6% |
| Church of the Nazarene | 1.7% |
| Adventist | 1.5% |
| Assembly of God | 0.9% |
| Universal Kingdom of God | 0.4% |
| God and Love | 0.1% |
| Christian | 3.4% |
| Christian Rationalism | 1.9% |
| Jehovah’s Witness | 1% |
| New Apostolic | 0.5% |
| Muslim | 1.8% |
| Other | 1.3% |
| None | 10.8% |
| Unspecified | 0.7% |
| Life expectancy (2020) | |
| Male | 70.8 years |
| Female | 75.6 years |
| Total population | 73.2 years (149th) |
| Homicides | |
| Total (2018) | 6.8 per 100,000 people (46th) |
| Geography | |
| Land area | 4,033 km2 |
| water area | 0 km2 |
| total area | 4,033 km2 (176th) |
| Lowest point | |
| Atlantic Ocean | 0 m |
| Highest point | |
| Mt. Fogo (a volcano on Fogo Island) | 2,829 m |
| Land use (2011) | |
| Agricultural land | 18.6% |
| Arable land | 11.7% |
| Permanent crops | 0.7% |
| Permanent pasture | 6.2% |
| Forest | 21% |
| Other | 60.4% |
| Urbanization | |
| Urban population (2020) | 66.7% |
| Rate of urbanization | 1.97% annual rate of change (2015 – 2020) |
| Economy | |
| Labor force (2007) | 196,100 (174th) |
| Unemployment rate (2017) | 9% (131st) |
| GDP (PPP) (estimate 2019) | |
| Total | $4.323 billion |
| Per capita | $7,728 |
| GDP (nominal) (estimate 2019) | |
| Total | $2.042 billion |
| Per capita | $3,651 |
| GDP by sector (estimate 2017) | |
| Agriculture | 8.9% |
| Industry | 17.5% |
| Services | 73.7% |
| Exports (2017) | $189 million (190th) |
| Exports partners (2017) | |
| Spain | 45.3% |
| Portugal | 40.3% |
| Netherlands | 8.1% |
| Imports (2017) | $836.1 million (189th) |
| Imports partners (2017) | |
| Portugal | 43.9% |
| Spain | 11.6% |
| Netherlands | 6.1% |
| China | 6.1% |
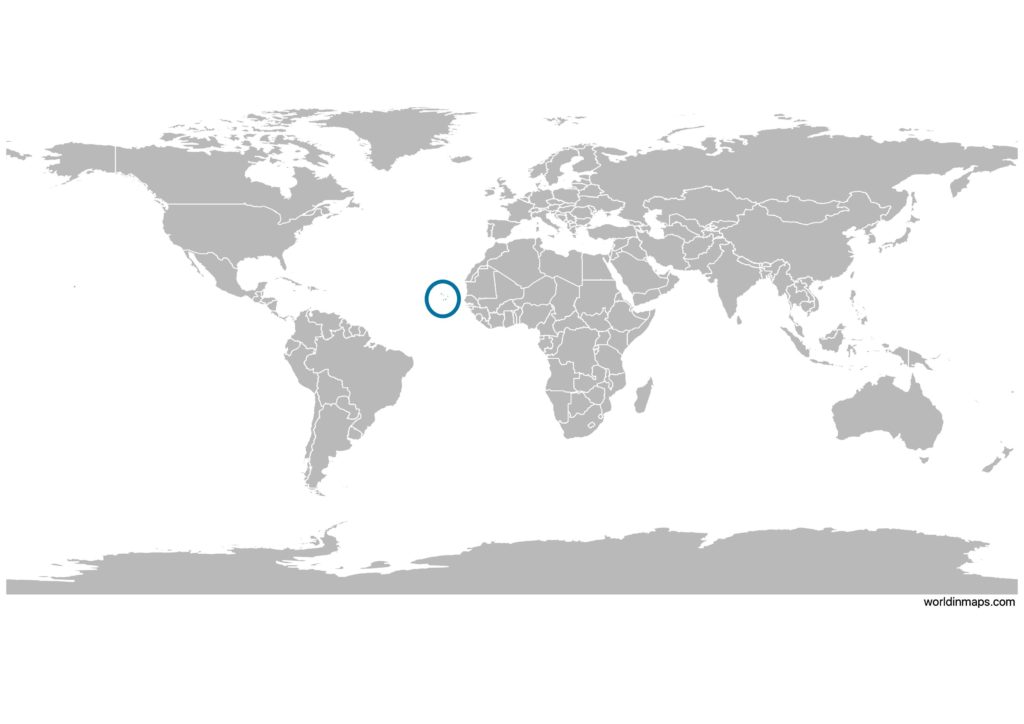
Cape Verde on the world map
Cape Verde (or Cabo Verde) top 10 largest cities (2010)
- Praia (127,832)
- Mindelo (70,468)
- Santa Maria (23,839)
- Assomada (12,026)
- Porto Novo (9,430)
- Pedra Badejo (9,345)
- São Filipe (8,125)
- Tarrafal (6,177)
- Sal Rei (5,407)
- Ribeira Grande (4,625)
Demography
Population pyramid
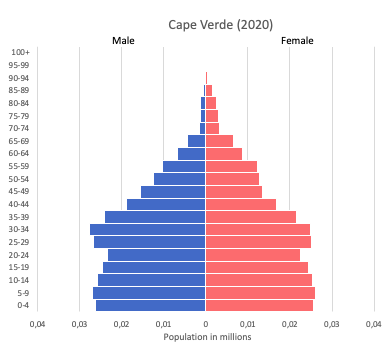
Age structure data
Estimate for 2020:
- 0-14 years: 27.95% (male 82,010/female 81,012)
- 15-24 years: 18.69% (male 54,521/female 54,504)
- 25-54 years: 40.76% (male 115,811/female 121,923)
- 55-64 years: 7.12% (male 18,939/female 22,597)
- 65 years and over: 5.48% (male 12,037/female 19,901)
Remark: the age structure of a population affects a nation’s key socioeconomic issues. Countries with young populations (high percentage under age 15) need to invest more in schools, while countries with older populations (high percentage ages 65 and over) need to invest more in the health sector. The age structure can also be used to help predict potential political issues. For example, the rapid growth of a young adult population unable to find employment can lead to unrest.
Population from 1950 to 2020
Source: United Nations, Department of Economic and Social Affairs, Population Division (2019). World Population Prospects 2019, Online Edition. Rev. 1.
Evolution of the life expectancy from 1960 to 2018
Source: World Development Indicators, The World Bank
Economy
Agriculture:
bananas, corn, beans, sweet potatoes, sugarcane, coffee, peanuts, fish
Industries:
food and beverages, fish processing, shoes and garments, salt mining, ship repair
Exports – commodities:
fuel (re-exports), shoes, garments, fish, hides
Imports – commodities:
foodstuffs, industrial products, transport equipment, fuels
Time zone and current time in Cape Verde (or Cabo Verde)
Go to our interactive map to get the current time in Cape Verde