Australia
| Government | |
| Name | Commonwealth of Australia |
| Government type | federal parliamentary democracy under a constitutional monarchy (a Commonwealth realm) |
| Capital | Canberra (426,704 (2019)) |
| Currency | Australian dollar (AUD) |
| Organization | |
| Member State | Commonwealth of Nations |
| Observer State | South Asian Association for Regional Cooperation (SAARC) |
| People | |
| Population (2020) | 25,499,881(54th) |
| Density of population | 3.3 P/km2 (192nd) |
| Nationality | Australian |
| Official languages | |
| English | |
| Ethnic groups (2011) | |
| English | 25.9% |
| Australian | 25.4% |
| Irish | 7.5% |
| Scottish | 6.4% |
| Italian | 3.3% |
| German | 3.2% |
| Chinese | 3.1% |
| Indian | 1.4% |
| Greek | 1.4% |
| Dutch | 1.2% |
| Australian aboriginal | 0.5% |
| Other | 15.3% |
| Unspecified | 5.4% |
| Religion | |
| Protestant | 23.1% |
| Anglican | 13.3% |
| Uniting Church | 3.7% |
| Presbyterian and Reformed | 2.3% |
| Baptist | 1.5% |
| Pentecostal | 1.1% |
| Lutheran | 0.7% |
| Other Protestant | 0.5% |
| Roman Catholic | 22.6% |
| Other Christian | 4.2% |
| Muslim | 2.6% |
| Buddhist | 2.4% |
| Orthodox | 2.3% |
| Eastern Orthodox | 2.1% |
| Oriental Orthodox | 0.2% |
| Hindu | 1.9% |
| Other | 1.3% |
| None | 30.1% |
| Unspecified | 9.6% |
| Life expectancy (2020) | |
| Male | 80.5 years |
| Female | 85.0 years |
| Total population | 82.7 years (14th) |
| Homicides | |
| Total (2018) | 0.9 per 100,000 people (145th) |
| Geography | |
| Land area | 7,682,300 km2 |
| water area | 58,920 km2 |
| total area | 7,741,220 km2 (7th) |
| Mean elevation | 330 m |
| Lowest point | |
| Lake Eyre | -15 m |
| Highest point | |
| Mount Kosciuszko | 2,228 m |
| Land use (2016) | |
| Agricultural land | 52.9% |
| Arable land | 11.6% |
| Permanent crops | 0.09% |
| Permanent pasture | 88.4% |
| Forest | 16.2% |
| Other | 30.9% |
| Urbanization | |
| Urban population (2020) | 86.2% |
| Rate of urbanization | 1.43% annual rate of change (2015 – 2020) |
| Economy | |
| Labor force (2017) | 12.91 million (44th) |
| Agriculture | 3.6% |
| Industry | 21.1% |
| Services | 75.3% |
| Unemployment rate (2017) | 5.6% (81rd) |
| GDP (PPP) (estimate 2020) | |
| Total | $1.423 trillion (19th) |
| Per capita | $54,799 (17th) |
| GDP (nominal) (estimate 2020) | |
| Total | $1.375 trillion (13th) |
| Per capita | $52,952 (10th) |
| GDP by sector (estimate 2017) | |
| Agriculture | 3.6% |
| Industrie | 25.3% |
| Services | 71.2% |
| Exports (2017) | $231.6 billion (22nd) |
| Exports partners (2017) | |
| China | 33.5% |
| Japan | 14.6% |
| South Korea | 6.6% |
| India | 5% |
| Hong Kong | 4% |
| Imports (2017) | $221 billion (24th) |
| Imports partners (2017) | |
| China | 22.9% |
| US | 10.8% |
| Japan | 7.5% |
| Thailand | 5.1% |
| Germany | 4.9% |
| South Korea | 4.5% |
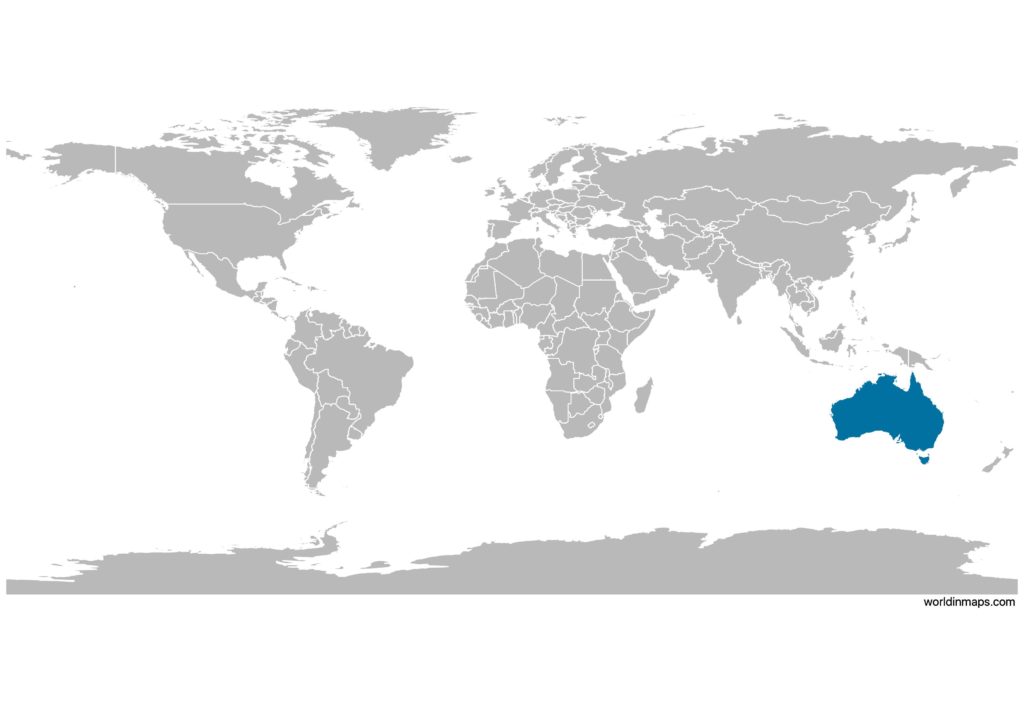
Australia on the world map
Australia top 10 largest cities (2019)
- Sydney (5,312,163)
- Melbourne (5,078,193)
- Brisbane (2,514,184)
- Perth (2,085,973)
- Adelaide (1,359,760)
- Gold Coast (693,671)
- Newcastle (491,474)
- Canberra (462,136)
- Sunshine Coast (341,069)
- Wollongong (306,034)
Demography
Population pyramid
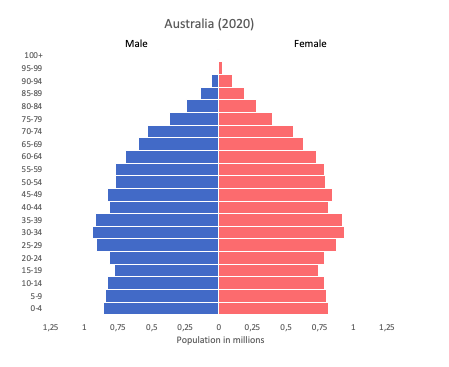
Age structure data
Estimate for 2020:
- 0-14 years: 18.72% (male 2,457,418/female 2,309,706)
- 15-24 years: 12.89% (male 1,710,253/female 1,572,794)
- 25-54 years: 41.15% (male 5,224,840/female 5,255,041)
- 55-64 years: 11.35% (male 1,395,844/female 1,495,806)
- 65 years and over: 15.88% (male 1,866,761/female 2,177,996) (2020 est.)
Remark: the age structure of a population affects a nation’s key socioeconomic issues. Countries with young populations (high percentage under age 15) need to invest more in schools, while countries with older populations (high percentage ages 65 and over) need to invest more in the health sector. The age structure can also be used to help predict potential political issues. For example, the rapid growth of a young adult population unable to find employment can lead to unrest.
Population from 1950 to 2020
Source: United Nations, Department of Economic and Social Affairs, Population Division (2019). World Population Prospects 2019, Online Edition. Rev. 1.
Evolution of the life expectancy from 1960 to 2018
Source: World Development Indicators, The World Bank
Economy
Agriculture:
wheat, barley, sugarcane, fruits, cattle, sheep, poultry
Industries:
mining, industrial and transportation equipment, food processing, chemicals, steel
Exports – commodities:
iron ore, coal, gold, natural gas, beef, aluminum oxide, wheat, meat (excluding beef), wool, alumina, alcohol
Imports – commodities:
motor vehicles, refined petroleum, telecommunication equipment and parts, crude petroleum, medicaments, goods vehicles, gold, computers
Time zone and current time in Australia
Go to our interactive map to get the current time in Australia