Japan
| Government | |
| Name | Japan |
| Japanese | 日本国 Nippon-koku or Nihon-koku |
| Government type | Parliamentary constitutional monarchy |
| Capital | Tokyo (9,272,740 (2015)) |
| Currency | Japanese yen (JPY) |
| Organization | |
| Observer State | South Asian Association for Regional Cooperation (SAARC) |
| People | |
| Population (2020) | 126,476,458 (11th) |
| Density of population | 334 P/km2 (24th) |
| Nationality | Japanese |
| Official languages | |
| Japanese | |
| Ethnic groups (2016) | |
| Japanese | 98.1% |
| Chinese | 0.5% |
| Korean | 0.4% |
| Other | 1% |
| Religions (2010) | |
| Shintoism | 70.4% |
| Buddhism | 69.8% |
| Christianity | 1.5% |
| Other | 6.9% |
| note: total adherents exceeds 100% because many people practice both Shintoism and Buddhism | |
| Life expectancy (2020) | |
| Male | 82.7 years |
| Female | 89.5 years |
| Total population | 86 years (2nd) |
| Homicides | |
| Total (2018) | 0.3 per 100,000 people (172nd) |
| Geography | |
| Land area | 364,485 km2 |
| water area | 13,430 km2 |
| total area | 377,915 km2 (63rd) |
| Mean elevation | 438 m |
| Lowest point | |
| Hachiro-gata | -4 m |
| Highest point | |
| Mount Fuji | 3,776 m |
| Land use (2011) | |
| Agricultural land | 12.5% |
| Arable land | 11.7% |
| Permanent crops | 0.8% |
| Permanent pasture | 0% |
| Forest | 68.5% |
| Other | 19% |
| Urbanization | |
| Urban population (2020) | 91.8% |
| Rate of urbanization | -0.14% annual rate of change (2015 – 2020) |
| Economy | |
| Labor force (2017) | 65.01 million (8th) |
| Labor force by occupation (2015) | |
| Agriculture | 2.9% |
| Industry | 26.2% |
| Services | 70.9% |
| Unemployment rate (2017) | 2.9% (34th) |
| GDP (PPP) (estimate 2020) | |
| Total | $5.888 trillion (4th) |
| Per capita | $46,827(28th) |
| GDP (nominal) (estimate 2020) | |
| Total | $5.413 trillion (3rd) |
| Per capita | $43,043 (22nd) |
| GDP by sector (estimate 2017) | |
| Agriculture | 1.1% |
| Industry | 30.1% |
| Services | 68.7% |
| Exports (2017) | $688.9 billion (4th) |
| Exports partners (2017) | |
| US | 19.4% |
| China | 19% |
| South Korea | 7.6% |
| Hong Kong | 5.1% |
| Thailand | 4.2% |
| Imports (2017) | $644.7 billion (4th) |
| Imports partners (2017) | |
| China | 24.5% |
| US | 11% |
| Australia | 5.8% |
| South Korea | 4.2% |
| Saudi Arabia | 4.1% |
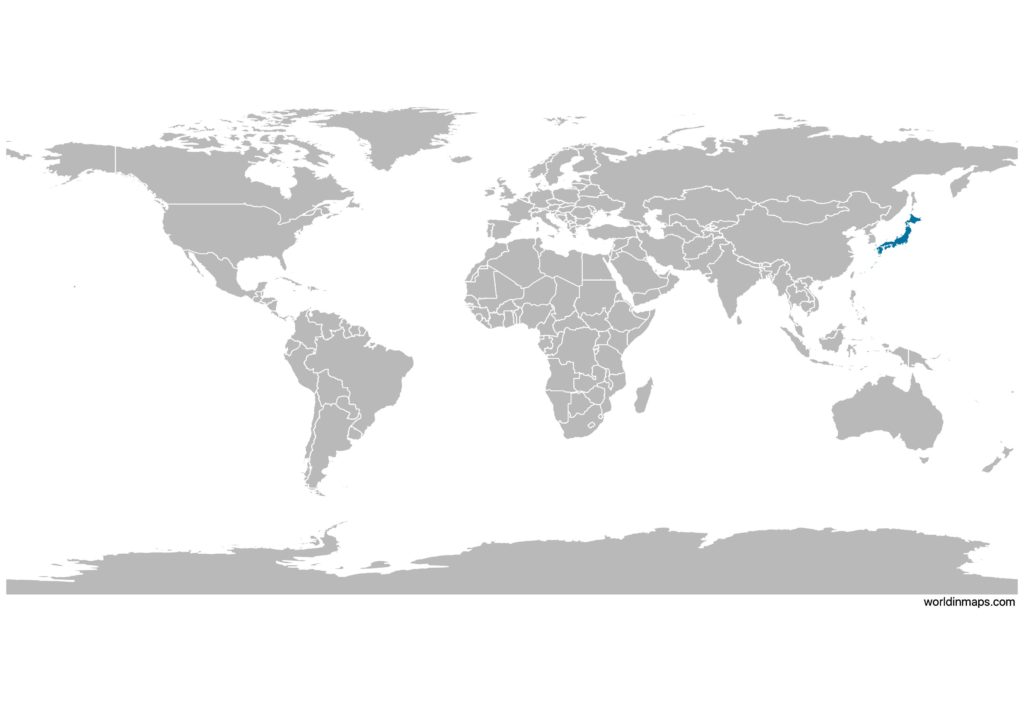
Japan on the world map
Japan top 10 largest cities (2015)
- Tokyo (9,272,740)
- Yokohama (3,724,844)
- Osaka (2,691,185)
- Nagoya (2,295,638)
- Sapporo (1,952,356)
- Fukuoka (1,538,681)
- Kobe (1,537,272)
- Kawasaki (1,475,213)
- Kyoto (1,475,183)
- Saitama (1,263,979)
Demography
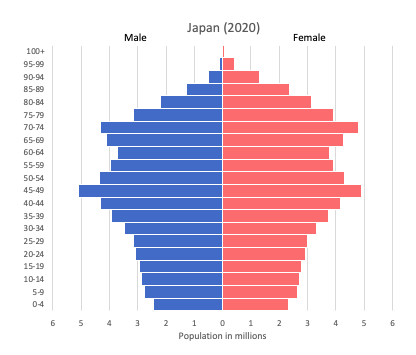
Population pyramid
Age structure data
Estimate for 2020:
- 0-14 years: 12.49% (male 8,047,183/female 7,623,767)
- 15-24 years: 9.47% (male 6,254,352/female 5,635,377)
- 25-54 years: 36.8% (male 22,867,385/female 23,317,140)
- 55-64 years: 12.06% (male 7,564,067/female 7,570,732)
- 65 years and over: 29.18% (male 16,034,973/female 20,592,496)
Remark: the age structure of a population affects a nation’s key socioeconomic issues. Countries with young populations (high percentage under age 15) need to invest more in schools, while countries with older populations (high percentage ages 65 and over) need to invest more in the health sector. The age structure can also be used to help predict potential political issues. For example, the rapid growth of a young adult population unable to find employment can lead to unrest.
Population from 1950 to 2020
Source: United Nations, Department of Economic and Social Affairs, Population Division (2019). World Population Prospects 2019, Online Edition. Rev. 1.
Evolution of the life expectancy from 1960 to 2018
Source: World Development Indicators, The World Bank
Economy
Agriculture:
vegetables, rice, fish, poultry, fruit, dairy products, pork, beef, flowers, potatoes/taros/yams, sugarcane, tea, legumes, wheat and barley
Industries:
among world’s largest and most technologically advanced producers of motor vehicles, electronic equipment, machine tools, steel and nonferrous metals, ships, chemicals, textiles, processed foods
Exports – commodities (2014):
14.9% motor vehicles, 5.4% iron and steel products, 5% semiconductors, 4.8% auto parts, 3.5% power generating machinery, 3.3% plastic materials
Imports – commodities (2014):
16.1% petroleum, 9.1% liquid natural gas, 3.8% clothing, 3.3% semiconductors, 2.4% coal, 1.4% audio and visual apparatus
Time zone and current time in Japan
Go to our interactive map to get the current time in Japan