Lesotho
| Government | |
| Name | Kingdom of Lesotho |
| Sesotho | ‘Muso oa Lesotho |
| Government type | parliamentary constitutional monarchy |
| Capital | Maseru (330,760 (2016)) |
| Currency | Lesotho loti (LSL) South African rand (ZAR) |
| Organization | |
| Member State | Commonwealth of Nations |
| People | |
| Population (2020) | 2,142,252 (144th) |
| Density of population | 68.1 P/km2 (138th) |
| Nationality | Basotho |
| Official languages | |
| Sesotho | |
| English | |
| Ethnic groups | |
| Sotho | 99.7% |
| Other | 0.3% |
| Religions (2014) | |
| Protestant | 47.8% |
| Pentecostal | 23.1% |
| Lesotho Evangelical | 17.3% |
| Anglican | 7.4% |
| Roman Catholic | 39.3% |
| other Christian | 9.1% |
| non-Christian | 1.4% |
| none | 2.3% |
| Life expectancy (2020) | |
| Male | 53.1 years |
| Female | 53 years |
| Total population | 53 years (227th) |
| Homicides | |
| Total (2015) | 43.6 per 100,000 people (3rd) |
| Geography | |
| Land area | 30,355 km2 |
| water area | 0 km2 |
| total area | 30,355 km2 (142nd) |
| Mean elevation | 2,161 m |
| Lowest point | |
| junction of the Orange and Makhaleng Rivers | 1,400 m |
| Highest point | |
| Thabana Ntlenyana | 3,482 m |
| Land use (2011) | |
| Agricultural land | 76.1% |
| Arable land | 10.1% |
| Permanent crops | 0.1% |
| Permanent pasture | 65.9% |
| Forest | 1.5% |
| Other | 22.4% |
| Urbanization | |
| Urban population (2020) | 29% |
| Rate of urbanization | 2.83% annual rate of change (2015 – 2020) |
| Economy | |
| Labor force (2017) | 930,800 (148th) |
| Labor force by occupation (2002) | |
| Agriculture | 86% |
| Industry and services | 14% |
| Unemployment rate (2017) | 7.1% (108th) |
| note: most of the resident population is engaged in subsistence agriculture roughly 35% of the active male wage earners work in South Africa | |
| GDP (PPP) (estimate 2017) | |
| Total | $7.448 billion |
| Per capita | $3,868 |
| GDP (nominal) (estimate 2017) | |
| Total | $2.721 billion |
| Per capita | $1,413 |
| GDP by sector (estimate 2016) | |
| Agriculture | 5.8% |
| Industry | 39.2% |
| Services | 54.9% |
| Exports (2017) | $1.028 billion (159th) |
| Exports partners (2017) | |
| South Africa | 57% |
| US | 33.5% |
| Imports (2017) | $1.826 billion (172nd) |
| Imports partners (2017) | |
| South Africa | 87.2% |
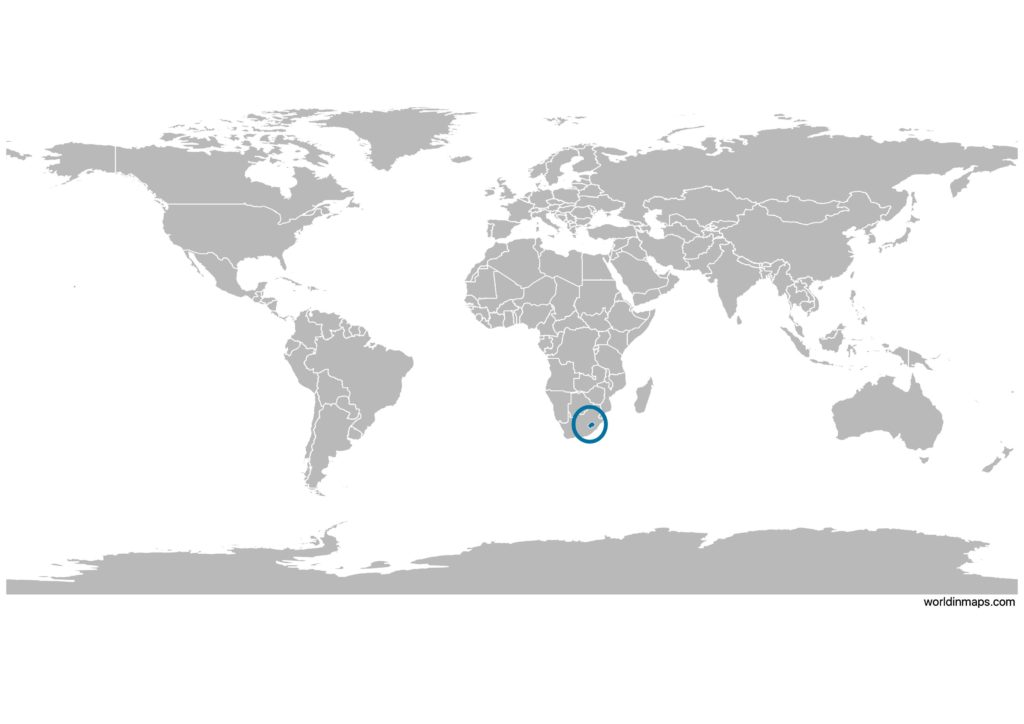
Lesotho on the world map
Lesotho top 10 largest cities (2016)
- Maseru (330,760)
- Teyateyaneng (75,115)
- Maputsoe (55,541)
- Mohale’s Hoek (40,040)
- Mafeteng (39,754)
- Hlotse (38,558)
- Butha-Buthe (35,108)
- Quthing (27,314)
- Qacha’s Nek (15,917)
- Thaba-Tseka (15,248)
Demography
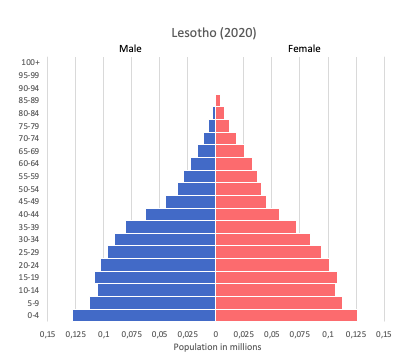
Population pyramid
Age structure data
Estimate for 2020:
- 0-14 years: 31.3% (male 309,991/female 306,321)
- 15-24 years: 19.26% (male 181,874/female 197,452)
- 25-54 years: 38.86% (male 373,323/female 391,901)
- 55-64 years: 4.98% (male 52,441/female 45,726)
- 65 years and over: 5.6% (male 57,030/female 53,275)
Remark: the age structure of a population affects a nation’s key socioeconomic issues. Countries with young populations (high percentage under age 15) need to invest more in schools, while countries with older populations (high percentage ages 65 and over) need to invest more in the health sector. The age structure can also be used to help predict potential political issues. For example, the rapid growth of a young adult population unable to find employment can lead to unrest.
Population from 1950 to 2020
Source: United Nations, Department of Economic and Social Affairs, Population Division (2019). World Population Prospects 2019, Online Edition. Rev. 1.
Evolution of the life expectancy from 1960 to 2018
Source: World Development Indicators, The World Bank
Major river
- Orange (2,200 km / 1,400 mi)
Economy
Agriculture:
corn, wheat, pulses, sorghum, barley, livestock
Industries:
food, beverages, textiles, apparel assembly, handicrafts, construction, tourism
Exports – commodities:
manufactures (clothing, footwear), wool and mohair, food and live animals, electricity, water, diamonds
Imports – commodities:
food, building materials, vehicles, machinery, medicines, petroleum products
Time zone and current time in Lesotho
Go to our interactive map to get the current time in Lesotho