Moldova
| Government | |
| Name | Republic of Moldova |
| Romanian | Republica Moldova |
| Government type | parliamentary republic |
| Capital | Chișinău (644,204 (2014)) |
| Currency | Leu (MDL) |
| Organization | |
| Member State | Commonwealth of Independent States (CIS) |
| People | |
| Population (2020) | 4,033,963 (142nd) |
| Density of population | 90.5 P/km2 (93rd) |
| Nationality | Moldovan |
| Official languages | |
| Romanian (also named Moldovan) | |
| Ethnic groups (2014) | |
| Moldovan | 75.1% |
| Romanian | 7% |
| Ukrainian | 6.6% |
| Gagauz | 4.6% |
| Russian | 4.1% |
| Bulgarian | 1.9% |
| other | 0.8% |
| Religions | |
| Orthodox | |
| other Christian | |
| other | |
| agnostic | |
| Life expectancy (2020) | |
| Male | 68 years |
| Female | 76 years |
| Total population | 71.9 years (157th) |
| Homicides | |
| Total (2018) | 4.1 per 100,000 people (2nd) |
| Geography | |
| Land area | 32,891 km2 |
| water area | 960 km2 |
| total area | 33,851 km2 (140th) |
| Mean elevation | 139 m |
| Lowest point | |
| Dniester (Nistru) | 2 m |
| Highest point | |
| Dealul Balanesti | 430 m |
| Land use (2011) | |
| Agricultural land | 74.9% |
| Arable land | 55.1% |
| Permanent crops | 9.1% |
| Permanent pasture | 10.7% |
| Forest | 11.9% |
| Other | 13.2% |
| Urbanization | |
| Urban population (2020) | 42.8% |
| Rate of urbanization | -0.07% annual rate of change (2015 – 2020) |
| Economy | |
| Labor force (2017) | 1.295 million (136th) |
| Labor force by occupation (2017) | |
| Agriculture | 32.3% |
| Industry | 12% |
| Services | 55.7% |
| Unemployment rate (2017) | 4.1% (53rd) |
| GDP (PPP) (estimate 2019) | |
| Total | $27.271 billion |
| Per capita | $7,700 |
| GDP (nominal) (estimate 2019) | |
| Total | $12.037 billion |
| Per capita | $3,398 |
| GDP by sector (estimate 2017) | |
| Agriculture | 17.7% |
| Industry | 20.3% |
| Services | 62% |
| Exports (2017) | $1.858 billion (142nd) |
| Exports partners (2017) | |
| Romania | 24.6% |
| Russia | 13.7% |
| Italy | 9.1% |
| Germany | 6.2% |
| Ukraine | 5.3% |
| UK | 4.6% |
| Poland | 4.6% |
| Imports (2017) | $4.427 billion (136th) |
| Imports partners (2017) | |
| Romania | 15.5% |
| Ukraine | 11.4% |
| Russia | 10.6% |
| China | 10.4% |
| Germany | 8.9% |
| Italy | 6.9% |
| Turkey | 6.1% |
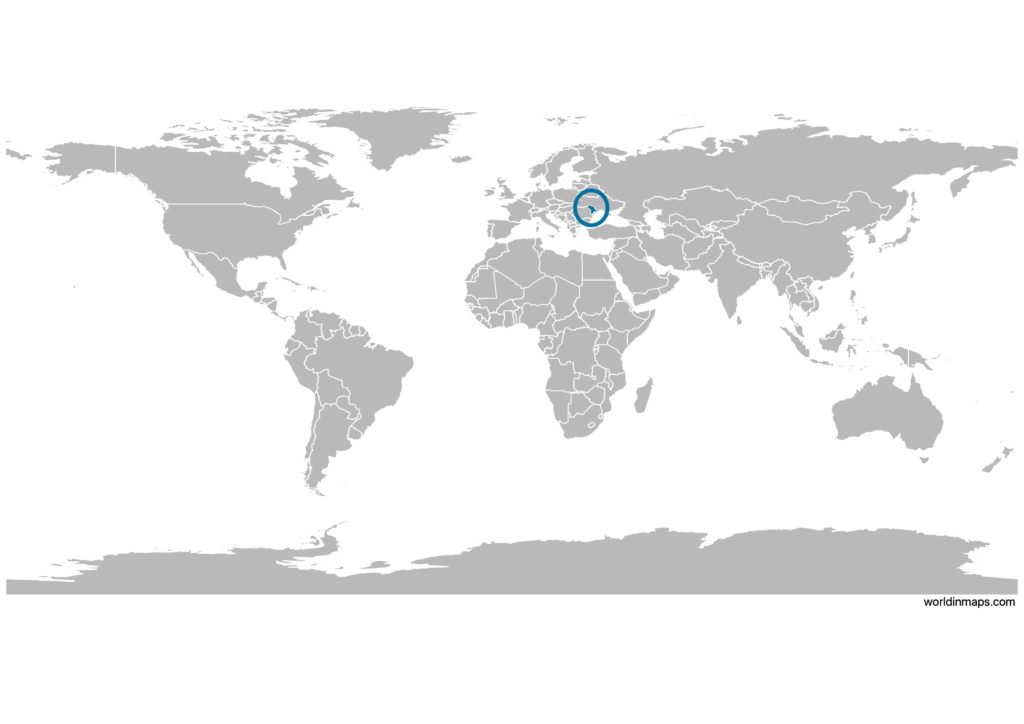
Moldova on the world map
Moldova top 10 largest cities
- Chișinău (644,204 – 2014)
- Tiraspol (129,500 – 2015)
- Bălți (102,457 -2014)
- Bender (91,000 – 2015)
- Rîbnița (46,000 – 2015)
- Ungheni (30,804 – 2014)
- Cahul (30,018 – 2014)
- Soroca (22,196 – 2014)
- Orhei (21,065 – 2014)
- Dubăsari (25,700 – 2011)
Demography
Population pyramid
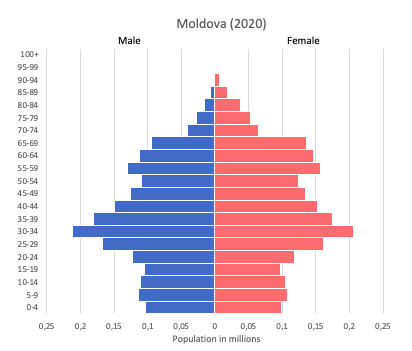
Age structure data
Estimate for 2020:
- 0-14 years: 18.31% (male 317,243/female 298,673)
- 15-24 years: 11.27% (male 196,874/female 182,456)
- 25-54 years: 43.13% (male 738,103/female 712,892)
- 55-64 years: 13.26% (male 205,693/female 240,555)
- 65 years and over: 14.03% (male 186,949/female 285,058)
Remark: the age structure of a population affects a nation’s key socioeconomic issues. Countries with young populations (high percentage under age 15) need to invest more in schools, while countries with older populations (high percentage ages 65 and over) need to invest more in the health sector. The age structure can also be used to help predict potential political issues. For example, the rapid growth of a young adult population unable to find employment can lead to unrest.
Population from 1950 to 2020
Source: United Nations, Department of Economic and Social Affairs, Population Division (2019). World Population Prospects 2019, Online Edition. Rev. 1.
Evolution of the life expectancy from 1960 to 2018
Source: World Development Indicators, The World Bank
Economy
Agriculture:
vegetables, fruits, grapes, grain, sugar beets, sunflower seeds, tobacco, beef, milk, wine
Industries:
sugar processing, vegetable oil, food processing, agricultural machinery, foundry equipment, refrigerators and freezers, washing machines, hosiery, shoes, textiles
Exports – commodities:
foodstuffs, textiles, machinery
Imports – commodities:
mineral products and fuel, machinery and equipment, chemicals, textiles
Time zone and current time in Moldova
Go to our interactive map to get the current time in Moldova