Italy

| Government | |
| Name | Italian Republic |
| Italian | Repubblica Italiana |
| Government type | Parliamentary republic |
| Capital | Rome (2,872,021 (2014)) |
| Currency | Euro (EUR) |
| People | |
| Population (2020) | 60,461,828 (23rd) |
| Density of population | 201.3 P/km2 (63rd) |
| Nationality | Italian |
| Official languages | |
| Italian | |
| Ethnic groups (2017) | |
| Italian | 91.5% |
| Others | 8.5% |
| Religions (2010) | |
| Christian (overwhelmingly Roman Catholic with very small groups of Jehovah’s Witnesses and Protestants) | 83.3% |
| Muslim | 3.7% |
| Unaffiliated | 12.4% |
| Other | 0.6% |
| Life expectancy (2020) | |
| Male | 79.8 years |
| Female | 85.3 years |
| Total population | 82.5 years (17th) |
| Homicides | |
| Total (2018) | 0.6 per 100,000 people (159th) |
| Geography | |
| Land area | 294,140 km2 |
| water area | 7,200 km2 |
| total area | 301,340 km2 (73rd) |
| Mean elevation | 538 m |
| Lowest point | |
| Mediterranean Sea | 0 m |
| Highest point | |
| Mont Blanc (Monte Bianco) de Courmayeur (a secondary peak of Mont Blanc) | 4,748 m |
| Land use (2011) | |
| Agricultural land | 47.1% |
| Arable land | 22.8% |
| Permanent crops | 8.6% |
| Permanent pasture | 15.7% |
| Forest | 31.4% |
| Other | 21.5% |
| Urbanization | |
| Urban population (2020) | 71% |
| Rate of urbanization | 0.29% annual rate of change (2015 – 2020) |
| Economy | |
| Labor force (2017) | 25.94 million (24th) |
| Labor force by occupation (2011) | |
| Agriculture | 3.9% |
| Industry | 28.3% |
| Services | 67.8% |
| Unemployment rate (2017) | 11.3% (153rd) |
| GDP (PPP) (estimate 2019) | |
| Total | $2.443 trillion (12th) |
| Per capita | $40,470 (33rd) |
| GDP (nominal) (estimate 2019) | |
| Total | $1.989 trillion (8th) |
| Per capita | $32,947 (25th) |
| GDP by sector (estimate 2017) | |
| Agriculture | 2.1% |
| Industry | 23.9% |
| Services | 73.9% |
| Exports (2017) | $496.3 billion (9th) |
| Exports partners (2017) | |
| Germany | 12.5% |
| France | 10.3% |
| US | 9% |
| Spain | 5.2% |
| UK | 5.2% |
| Switzerland | 4.6% |
| Imports (2017) | $432.9 billion (13th) |
| Imports partners (2017) | |
| Germany | 16.3% |
| France | 8.8% |
| China | 7.1% |
| Netherlands | 5.6% |
| Spain | 5.3% |
| Belgium | 4.5% |
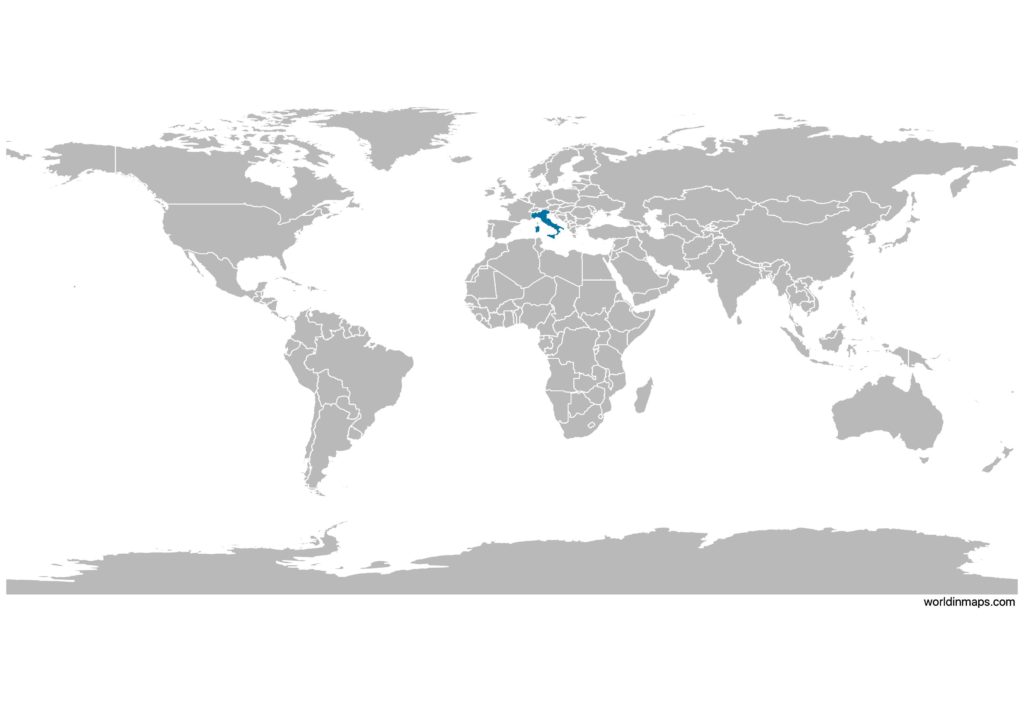
Italy on the world map
Italy top 10 largest cities (2014)
- Rome (2,872,021)
- Milan (1,337,155)
- Naples (978,399)
- Turin (896,773)
- Palermo (678,492)
- Genoa (592,507)
- Bologna (386,181)
- Florence (381,037)
- Bari (327,361)
- Catania (315,601)
Demography
Population pyramid
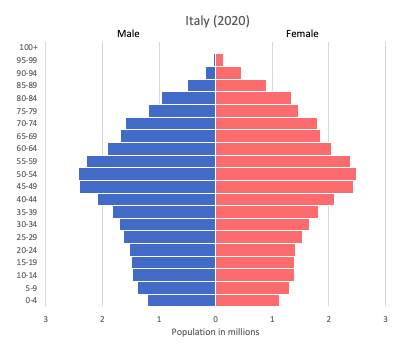
Age structure data
Estimate for 2020:
- 0-14 years: 13.45% (male 4,292,431/female 4,097,732)
- 15-24 years: 9.61% (male 3,005,402/female 2,989,764)
- 25-54 years: 40.86% (male 12,577,764/female 12,921,614)
- 55-64 years: 14% (male 4,243,735/female 4,493,581)
- 65 years and over: 22.08% (male 5,949,560/female 7,831,076)
Remark: the age structure of a population affects a nation’s key socioeconomic issues. Countries with young populations (high percentage under age 15) need to invest more in schools, while countries with older populations (high percentage ages 65 and over) need to invest more in the health sector. The age structure can also be used to help predict potential political issues. For example, the rapid growth of a young adult population unable to find employment can lead to unrest.
Population from 1950 to 2020
Source: United Nations, Department of Economic and Social Affairs, Population Division (2019). World Population Prospects 2019, Online Edition. Rev. 1.
Evolution of the life expectancy from 1960 to 2018
Source: World Development Indicators, The World Bank
Economy
Agriculture:
fruits, vegetables, grapes, potatoes, sugar beets, soybeans, grain, olives, beef, dairy products, fish
Industries:
tourism, machinery, iron and steel, chemicals, food processing, textiles, motor vehicles, clothing, footwear, ceramics
Exports – commodities:
engineering products, textiles and clothing, production machinery, motor vehicles, transport equipment, chemicals, foodstuffs, beverages, tobacco, minerals, nonferrous metals
Imports – commodities:
engineering products, chemicals, transport equipment, energy products, minerals and nonferrous metals, textiles and clothing, food, beverages, tobacco
Time zone and current time in Italy
Go to our interactive map to get the current time in Italy