Morocco
| Government | |
| Name | Kingdom of Morocco |
| Arabic | المملكة المغربية |
| Government type | parliamentary constitutional monarchy |
| Capital | Rabat (577,827 (2014)) |
| Currency | Moroccan dirham (MAD) |
| People | |
| Population (2020) | 36,910,558 (39th) |
| Density of population | 50.0 P/km2 |
| Nationality | Moroccan |
| Official languages | |
| Arabic | |
| Berber | |
| Ethnic groups | |
| Arab-Berber | 99% |
| Other | 1% |
| Religions (2010) | |
| Muslim (official; virtually all Sunni, <0.1% Shia) | 99% |
| other | 1% |
| Life expectancy (2020) | |
| Male | 71.6 years |
| Female | 75.1 years |
| Total population | 73.3 years (147th) |
| Homicides | |
| Total (2018) | 1.4 per 100,000 people (120th) |
| Geography | |
| Land area | 446,300 km2 |
| water area | 250 km2 |
| total area | 446,550 km2 (59th) |
| Mean elevation | 909 m |
| Lowest point | |
| Sebkha Tah | -59 m |
| Highest point | |
| Jebel Toubkal | 4,165 m |
| Land use (2011) | |
| Agricultural land | 67.5% |
| Arable land | 17.5% |
| Permanent crops | 2.9% |
| Permanent pasture | 47.1% |
| Forest | 11.5% |
| Other | 21% |
| Urbanization | |
| Urban population (2020) | 63.5% |
| Rate of urbanization | 2.14% annual rate of change (2015 – 2020) |
| Economy | |
| Labor force (2017) | 12 million (48th) |
| Labor force by occupation (2014) | |
| Agriculture | 39.1% |
| Industry | 20.3% |
| Services | 40.5% |
| Unemployment rate (2017) | 10.2% (143rd) |
| GDP (PPP) (estimate 2019) | |
| Total | $332.358 billion |
| Per capita | $9,339 |
| GDP (nominal) (estimate 2019) | |
| Total | $122.458 billion |
| Per capita | $3,441 |
| GDP by sector (estimate 2017) | |
| Agriculture | 14% |
| Industry | 29.5% |
| Services | 56.5% |
| Exports (2017) | $21.48 billion (69th) |
| Exports partners (2017) | |
| Spain | 23.2% |
| France | 22.6% |
| Italy | 4.5% |
| US | 4.2% |
| Imports (2017) | $39.64 billion (59th) |
| Imports partners (2017) | |
| Spain | 16.7% |
| France | 12.2% |
| China | 9.2% |
| US | 6.9% |
| Germany | 6% |
| Italy | 5.9% |
| Turkey | 4.5% |
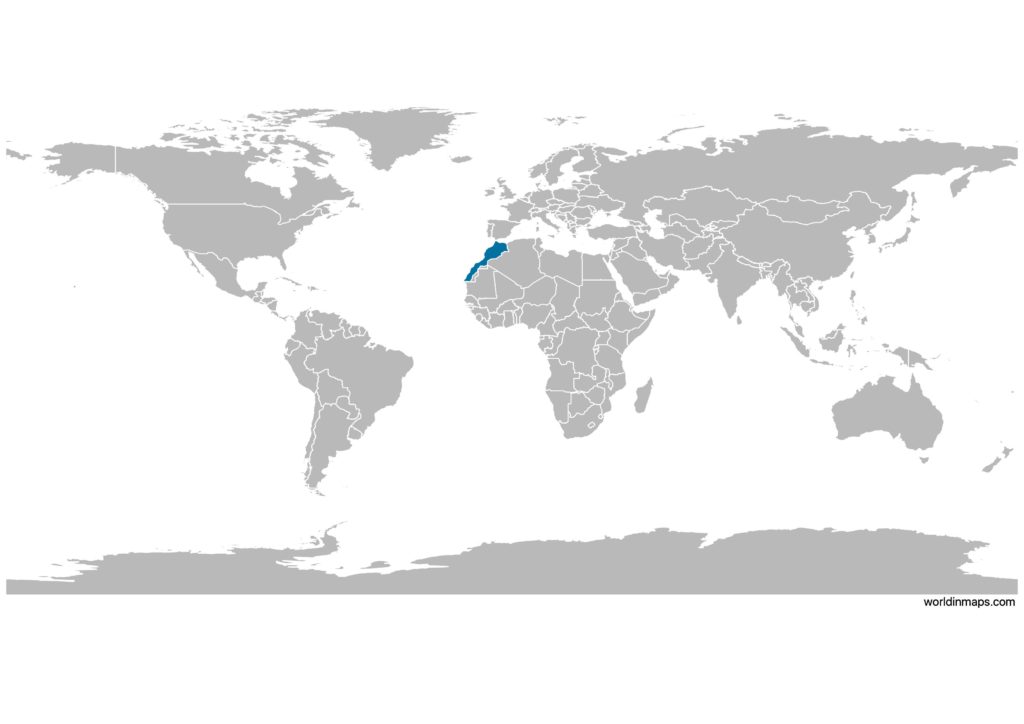
Morocco on the world map
Morocco top 10 largest cities (2014)
- Casablanca (3,359,818)
- Fez (1,112,072)
- Tangier (947,952)
- Marrakesh (928,850)
- Salé (890,403)
- Meknes (632,079)
- Rabat (577,827)
- Oujda (494,252)
- Kenitra (431,282)
- Agadir (421,844)
Demography
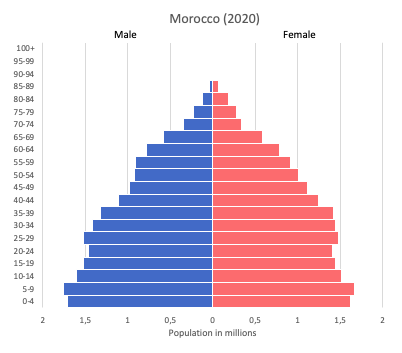
Population pyramid
Age structure data
Estimate for 2020:
- 0-14 years: 27.04% (male 4,905,626/female 4,709,333)
- 15-24 years: 16.55% (male 2,953,523/female 2,930,708)
- 25-54 years: 40.64% (male 7,126,781/female 7,325,709)
- 55-64 years: 8.67% (male 1,533,771/female 1,548,315)
- 65 years and over: 7.11% (male 1,225,307/female 1,302,581)
Remark: the age structure of a population affects a nation’s key socioeconomic issues. Countries with young populations (high percentage under age 15) need to invest more in schools, while countries with older populations (high percentage ages 65 and over) need to invest more in the health sector. The age structure can also be used to help predict potential political issues. For example, the rapid growth of a young adult population unable to find employment can lead to unrest.
Population from 1950 to 2020
Source: United Nations, Department of Economic and Social Affairs, Population Division (2019). World Population Prospects 2019, Online Edition. Rev. 1.
Evolution of the life expectancy from 1960 to 2018
Source: World Development Indicators, The World Bank
Economy
Agriculture:
barley, wheat, citrus fruits, grapes, vegetables, olives, livestock, wine
Industries:
automotive parts, phosphate mining and processing, aerospace, food processing, leather goods, textiles, construction, energy, tourism
Exports – commodities:
clothing and textiles, automobiles, electric components, inorganic chemicals, transistors, crude minerals, fertilizers (including phosphates), petroleum products, citrus fruits, vegetables, fish
Imports – commodities:
crude petroleum, textile fabric, telecommunications equipment, wheat, gas and electricity, transistors, plastics
Time zone and current time in Morocco
Go to our interactive map to get the current time in Morocco