Nepal

| Government | |
| Name | Federal Democratic Republic of Nepal |
| Nepali | सङ्घीय लोकतान्त्रिक गणतन्त्र नेपाल Saṅghīya Lokatāntrik Gaṇatantra Nepāl |
| Government type | federal parliamentary republic |
| Capital | Kathmandu (975,453) |
| Currency | Nepalese rupee (NPR) |
| Organization | |
| Member State | South Asian Association for Regional Cooperation (SAARC) |
| People | |
| Population (2020) | 29,136,808 (49th) |
| Density of population | 180 P/km2 (50th) |
| Nationality | Nepali |
| Official languages | |
| Nepali | |
| Ethnic groups (2011) | |
| Chhetri | 16.6% |
| Bahun | 12.2% |
| Magar | 7.1% |
| Tharu | 6.6% |
| Tamang | 5.8% |
| Newar | 5% |
| Kami | 4.8% |
| Muslims | 4.4% |
| Yadav | 4% |
| Others | 33.5% |
| Religions (2011) | |
| Hindu | 81.3% |
| Buddhist | 9% |
| Muslim | 4.4% |
| Kirant | 3.1% |
| Christian | 1.4% |
| other | 0.5% |
| unspecified | 0.2% |
| Life expectancy (2020) | |
| Male | 71.1 years |
| Female | 72.6 years |
| Total population | 71.8 years (160th) |
| Homicides | |
| Total (2016) | 2.3 per 100,000 people (98th) |
| Geography | |
| Land area | 143,351 km2 |
| water area | 3,830 km2 |
| total area | 147,181 km2 (96th) |
| Mean elevation | 2,565 m |
| Lowest point | |
| Kanchan Kalan | 70 m |
| Highest point | |
| Mount Everest (highest peak in Asia and highest point on earth above sea level) | 8,848 m |
| Land use (2011) | |
| Agricultural land | 28.8% |
| Arable land | 15.1% |
| Permanent crops | 1.2% |
| Permanent pasture | 12.5% |
| Forest | 25.4% |
| Other | 45.8% |
| Urbanization | |
| Urban population (2020) | 20.6% |
| Rate of urbanization | 3.15% annual rate of change (2015 – 2020) |
| Economy | |
| Labor force (2017) | 16.81 million (37th) |
| Labor force by occupation (2015) | |
| Agriculture | 69% |
| Industry | 12% |
| Services | 19% |
| Unemployment rate (2017) | 3% (36th) |
| GDP (PPP) (estimate 2019) | |
| Total | $94 billion (87th) |
| Per capita | $3,318 (155th) |
| GDP (nominal) (estimate 2019) | |
| Total | $30 billion (101st) |
| Per capita | $1,048 (159th) |
| GDP by sector (estimate 2017) | |
| Agriculture | 27% |
| Industry | 13.5% |
| Services | 59.5% |
| Exports (2017) | $818.7 million (168th) |
| Exports partners (2017) | |
| India | 53.1% |
| US | 11.8% |
| Turkey | 7.2% |
| Imports (2017) | $10 billion (101st) |
| Imports partners (2017) | |
| India | 70.2% |
| China | 7.5% |
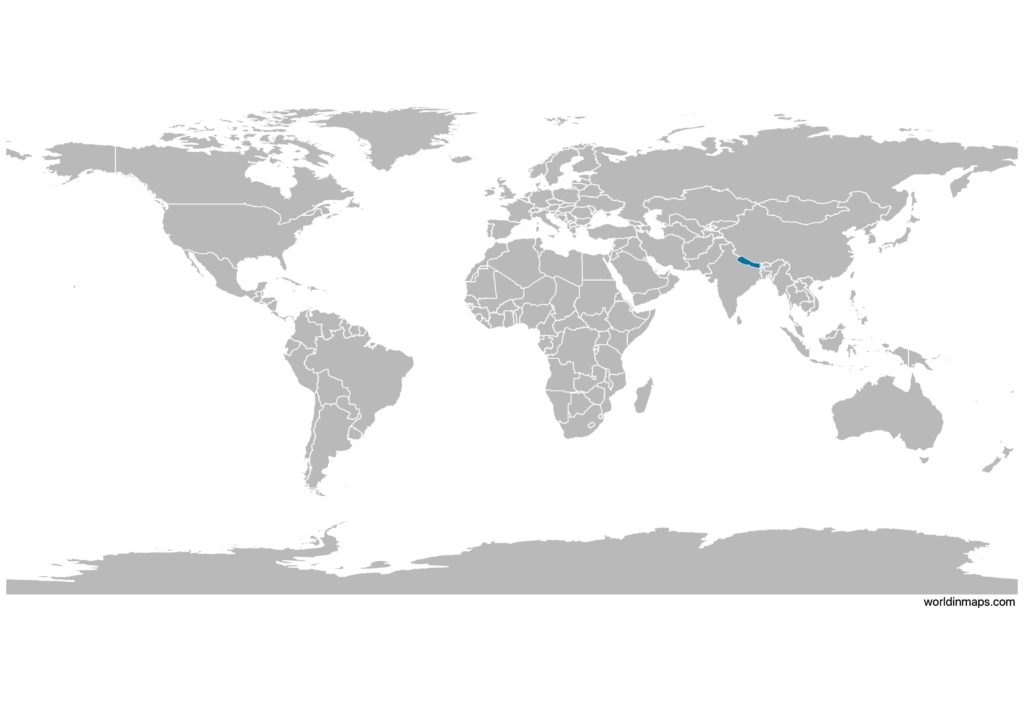
Nepal on the world map
Nepal top 10 largest cities
- Kathmandu (975,453)
- Pokhara (414,141)
- Lalitpur (284,922)
- Bharatpur (280,502)
- Birgunj (240,922)
- Biratnagar (214,662)
- Janakpur (159,468)
- Ghorahi (156,164)
- Hetauda (152,875)
- Dhangadhi (147,741)
Demography
Population pyramid
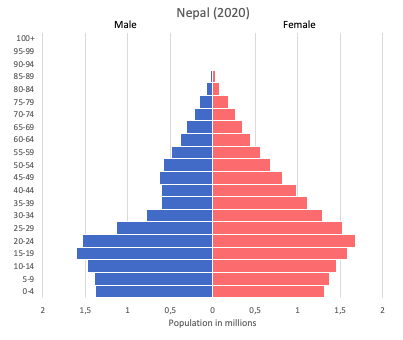
Age structure data
Estimate for 2020:
- 0-14 years: 28.36% (male 4,526,786/female 4,073,642)
- 15-24 years: 20.93% (male 3,276,431/female 3,070,843)
- 25-54 years: 38.38% (male 5,251,553/female 6,387,365)
- 55-64 years: 6.64% (male 954,836/female 1,059,360)
- 65 years and over: 5.69% (male 852,969/female 874,092)
Remark: the age structure of a population affects a nation’s key socioeconomic issues. Countries with young populations (high percentage under age 15) need to invest more in schools, while countries with older populations (high percentage ages 65 and over) need to invest more in the health sector. The age structure can also be used to help predict potential political issues. For example, the rapid growth of a young adult population unable to find employment can lead to unrest.
Population from 1950 to 2020
Source: United Nations, Department of Economic and Social Affairs, Population Division (2019). World Population Prospects 2019, Online Edition. Rev. 1.
Evolution of the life expectancy from 1960 to 2018
Source: World Development Indicators, The World Bank
Economy
Agriculture:
pulses, rice, corn, wheat, sugarcane, jute, root crops, milk, water buffalo meat
Industries:
tourism, carpets, textiles, small rice, jute, sugar, and oilseed mills, cigarettes, cement and brick production
Exports – commodities:
clothing, pulses, carpets, textiles, juice, jute goods
Imports – commodities:
petroleum products, machinery and equipment, gold, electrical goods, medicine
Time zone and current time in Nepal
Go to our interactive map to get the current time in Nepal