Tunisia
| Government | |
| Name | Republic of Tunisia |
| Arabic | الجمهورية التونسية al-Jumhūrīyah at-Tūnisīyah |
| French | République tunisienne |
| Government type | parliamentary republic |
| Capital | Tunis (638,845) |
| Currency | Tunisian dinar (TND) |
| People | |
| Population (2020) | 11,818,618 (78th) |
| Density of population | 71 P/km2 (133rd) |
| Nationality | Tunisian |
| Official languages | |
| Arabic | |
| Ethnic groups | |
| Arab | 98% |
| European | 1% |
| Jewish and other | 1% |
| Religions | |
| Muslim (official – Sunni) | 99% |
| other | 1% |
| Life expectancy (2020) | |
| Male | 74.6 years |
| Female | 78.1 years |
| Total population | 76.3 years (100th) |
| Homicides | |
| Total (2012) | 3.1 per 100,000 people (83rd) |
| Geography | |
| Land area | 155,360 km2 |
| water area | 8,250 km2 |
| total area | 163,610 km2 (94th) |
| Mean elevation | 246 m |
| Lowest point | |
| Shatt al Gharsah | -17 m |
| Highest point | |
| Jebel ech Chambi | 1,544 m |
| Land use (2011) | |
| Agricultural land | 64.8% |
| Arable land | 18.3% |
| Permanent crops | 15.4% |
| Permanent pasture | 31.1% |
| Forest | 6.6% |
| Other | 28.6% |
| Urbanization | |
| Urban population (2020) | 69.6% |
| Rate of urbanization | 1.53% annual rate of change (2015 – 2020) |
| Economy | |
| Labor force (2017) | 4.054 million (92nd) |
| Labor force by occupation (2014) | |
| Agriculture | 14.8% |
| Industry | 33.2% |
| Services | 51.7% |
| Unemployment rate (2017) | 15.5% (174th) |
| GDP (PPP) (estimate 2019) | |
| Total | $151.566 billion |
| Per capita | $12,862 |
| GDP (nominal) (estimate 2019) | |
| Total | $42.277 billion |
| Per capita | $3,587 |
| GDP by sector (estimate 2017) | |
| Agriculture | 10.1% |
| Industry | 26.2% |
| Services | 63.8% |
| Exports (2017) | $13.82 billion (78th) |
| Exports partners (2017) | |
| France | 32.1% |
| Italy | 17.3% |
| Germany | 12.4% |
| Imports (2017) | $19.09 billion (79th) |
| Imports partners (2017) | |
| Italy | 15.8% |
| France | 15.1% |
| China | 9.2% |
| Germany | 8.1% |
| Turkey | 4.8% |
| Algeria | 4.7% |
| Spain | 4.5% |
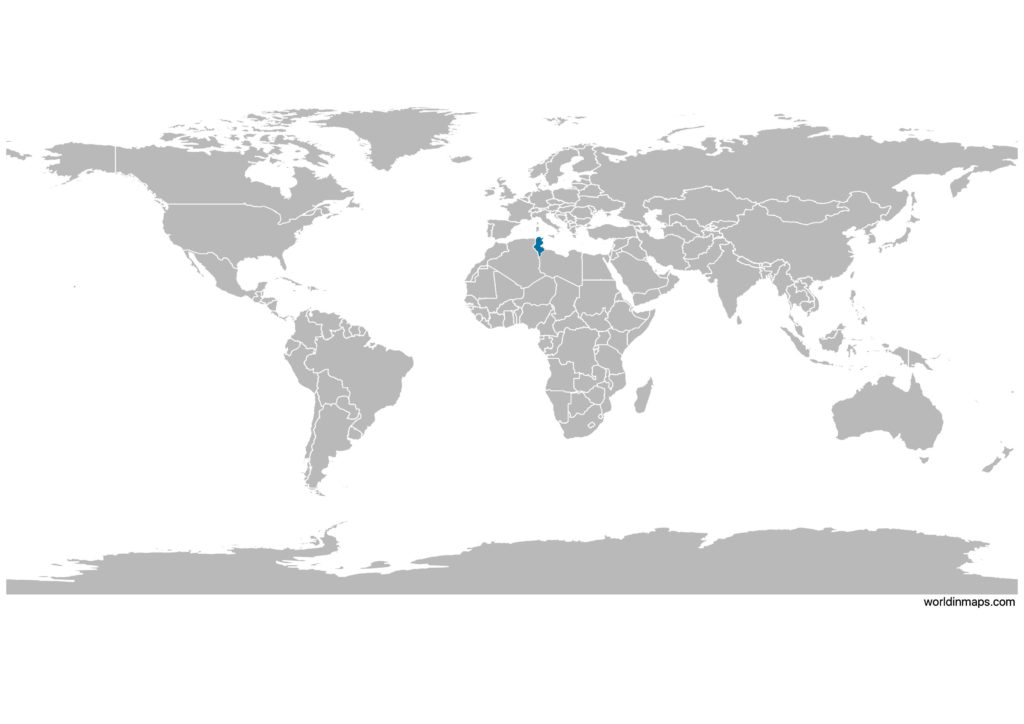
Tunisia on the world map
Tunisia top 10 largest cities
- Tunis (638,845)
- Sfax (272,801)
- Sousse (221,530)
- Ettadhamen (142,953)
- Kairouan (139,070)
- Bizerte (136,917)
- Gabès (130,984)
- Aryanah (114,486)
- Gafsa (105,264)
- El Mourouj (104,586)
Demography
Population pyramid
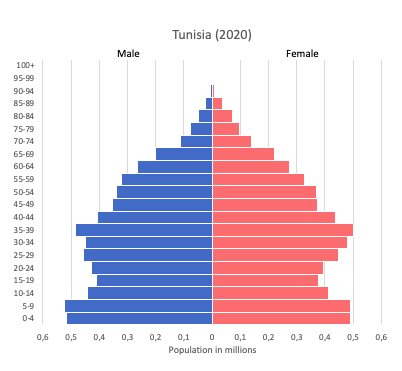
Age structure data
Estimate for 2020:
- 0-14 years: 25.28% (male 1,529,834/female 1,433,357)
- 15-24 years: 12.9% (male 766,331/female 745,888)
- 25-54 years: 42.85% (male 2,445,751/female 2,576,335)
- 55-64 years: 10.12% (male 587,481/female 598,140)
- 65 years and over: 8.86% (male 491,602/female 546,458)
Remark: the age structure of a population affects a nation’s key socioeconomic issues. Countries with young populations (high percentage under age 15) need to invest more in schools, while countries with older populations (high percentage ages 65 and over) need to invest more in the health sector. The age structure can also be used to help predict potential political issues. For example, the rapid growth of a young adult population unable to find employment can lead to unrest.
Population from 1950 to 2020
Source: United Nations, Department of Economic and Social Affairs, Population Division (2019). World Population Prospects 2019, Online Edition. Rev. 1.
Evolution of the life expectancy from 1960 to 2018
Source: World Development Indicators, The World Bank
Economy
Agriculture:
olives, olive oil, grain, tomatoes, citrus fruit, sugar beets, dates, almonds; beef, dairy products
Industries:
petroleum, mining (particularly phosphate, iron ore), tourism, textiles, footwear, agribusiness, beverages
Exports – commodities:
clothing, semi-finished goods and textiles, agricultural products, mechanical goods, phosphates and chemicals, hydrocarbons, electrical equipment
Imports – commodities:
textiles, machinery and equipment, hydrocarbons, chemicals, foodstuffs
Time zone and current time in Tunisia
Go to our interactive map to get the current time in Tunisia