Algeria
| Government | |
| Name | People’s Democratic Republic of Algeria |
| Arabic | الجمهورية الجزائرية الديمقراطية الشعبية |
| French | République algérienne démocratique et populaire |
| Government type | Presidential republic |
| Capital | Algiers (2,768,000 (2020)) |
| Currency | Dinar (DZD) |
| People | |
| Population (2020) | 43,851,043 (32nd) |
| Density of population | 17.7 P/km2 (168th) |
| Nationality | Algerian |
| Official languages | |
| Arabic | |
| Berber or Tamazight | |
| Language in administration, business and education | |
| French | |
| Ethnic groups | |
| Arab-Berber | 99% |
| European | <1% |
| Religion | |
| Muslim (predominantly Sunni) | 99% |
| Other (includes Christian and Jewish) | <1% |
| Life expectancy (2020) | |
| Male | 76.1 years |
| Female | 79.1 years |
| Total population | 77.5 years (77th) |
| Homicides | |
| Total (2015) | 1.4 per 100,000 people (122nd) |
| Literacy (2018) | |
| Definition: age 15 and over can read and write | |
| Male | 87.4% |
| Female | 75.3% |
| Total population | 81.4% |
| Geography | |
| Land area | 2,381,740 km2 |
| water area | 0 km2 |
| total area | 2,381,740km2 (11th) |
| Mean elevation | 800 m |
| Lowest point | |
| Chott Melrhir | -40 m |
| Highest point | |
| Tahat | 2,908 m |
| Land use (2016) | |
| Agricultural land | 17.4% |
| Arable land | 3.1% |
| Permanent crops | 0.4% |
| Permanent pasture | 13.8% |
| Forest | 0.8% |
| Other | 81.8% |
| Urbanization | |
| Urban population (2020) | 73.7% |
| Rate of urbanization | 2.46% annual rate of change (2015 – 2020) |
| Economy | |
| Labor force (2017) | 11.82 million (50th) |
| Agriculture | 10.8% |
| Industry | 30.9% |
| Services | 58.4% |
| Unemployment rate (2017) | 11.7% (155th) |
| GDP (PPP) (estimate 2019) | |
| Total | $684.649 billion (35th) |
| Per capita | $15,765 (82nd) |
| GDP (nominal) (estimate 2019) | |
| Total | $180.687 billion (53rd) |
| Per capita | $4,229 (109th) |
| GDP by sector (estimate 2017 | |
| Agriculture | 13.3% |
| Industrie | 39.3% |
| Services | 47.4% |
| Exports (2017) | $34.37 million (58th) |
| Exports partners (2017) | |
| Italy | 17.4% |
| Spain | 13% |
| France | 11.9% |
| US | 9.4% |
| Brazil | 6.2% |
| Netherlands | 5.5% |
| Imports (2017) | $48.54 billion (55th) |
| Imports partners (2017) | |
| China | 18.2% |
| France | 9.1% |
| Italy | 8% |
| Germany | 7% |
| Spain | 6.9% |
| Turkey | 4.4% |
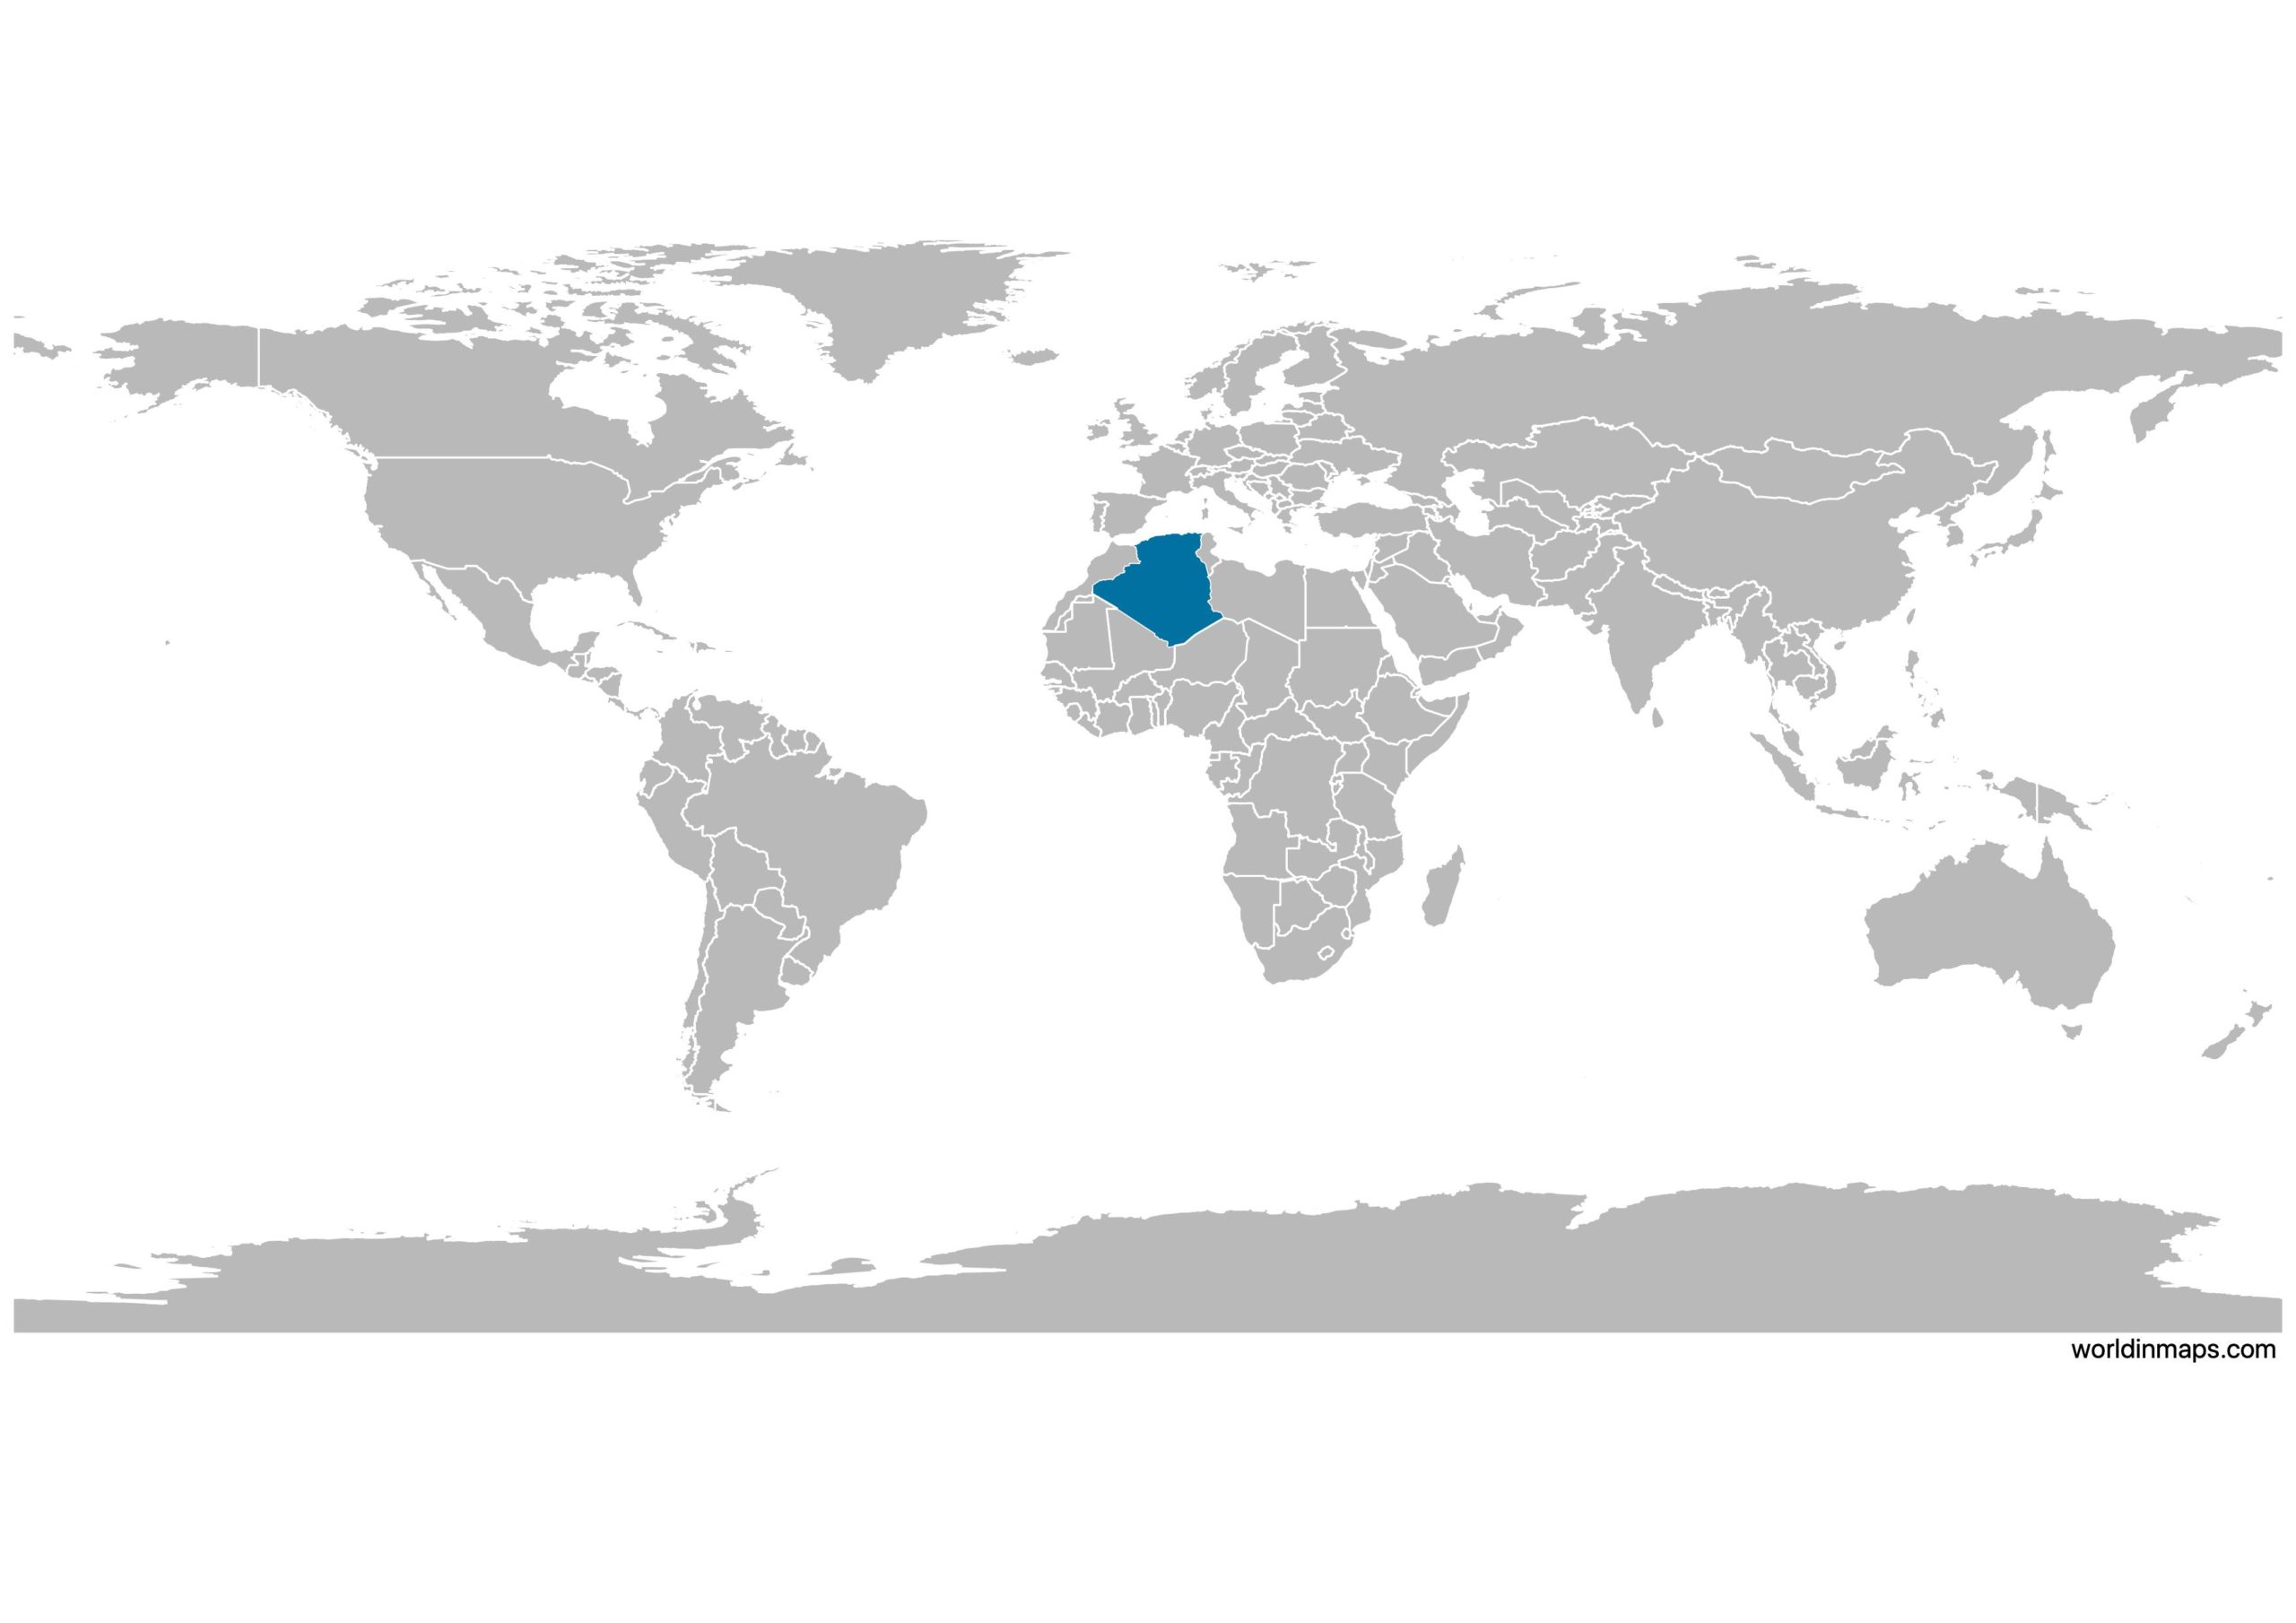
Algeria on the world map
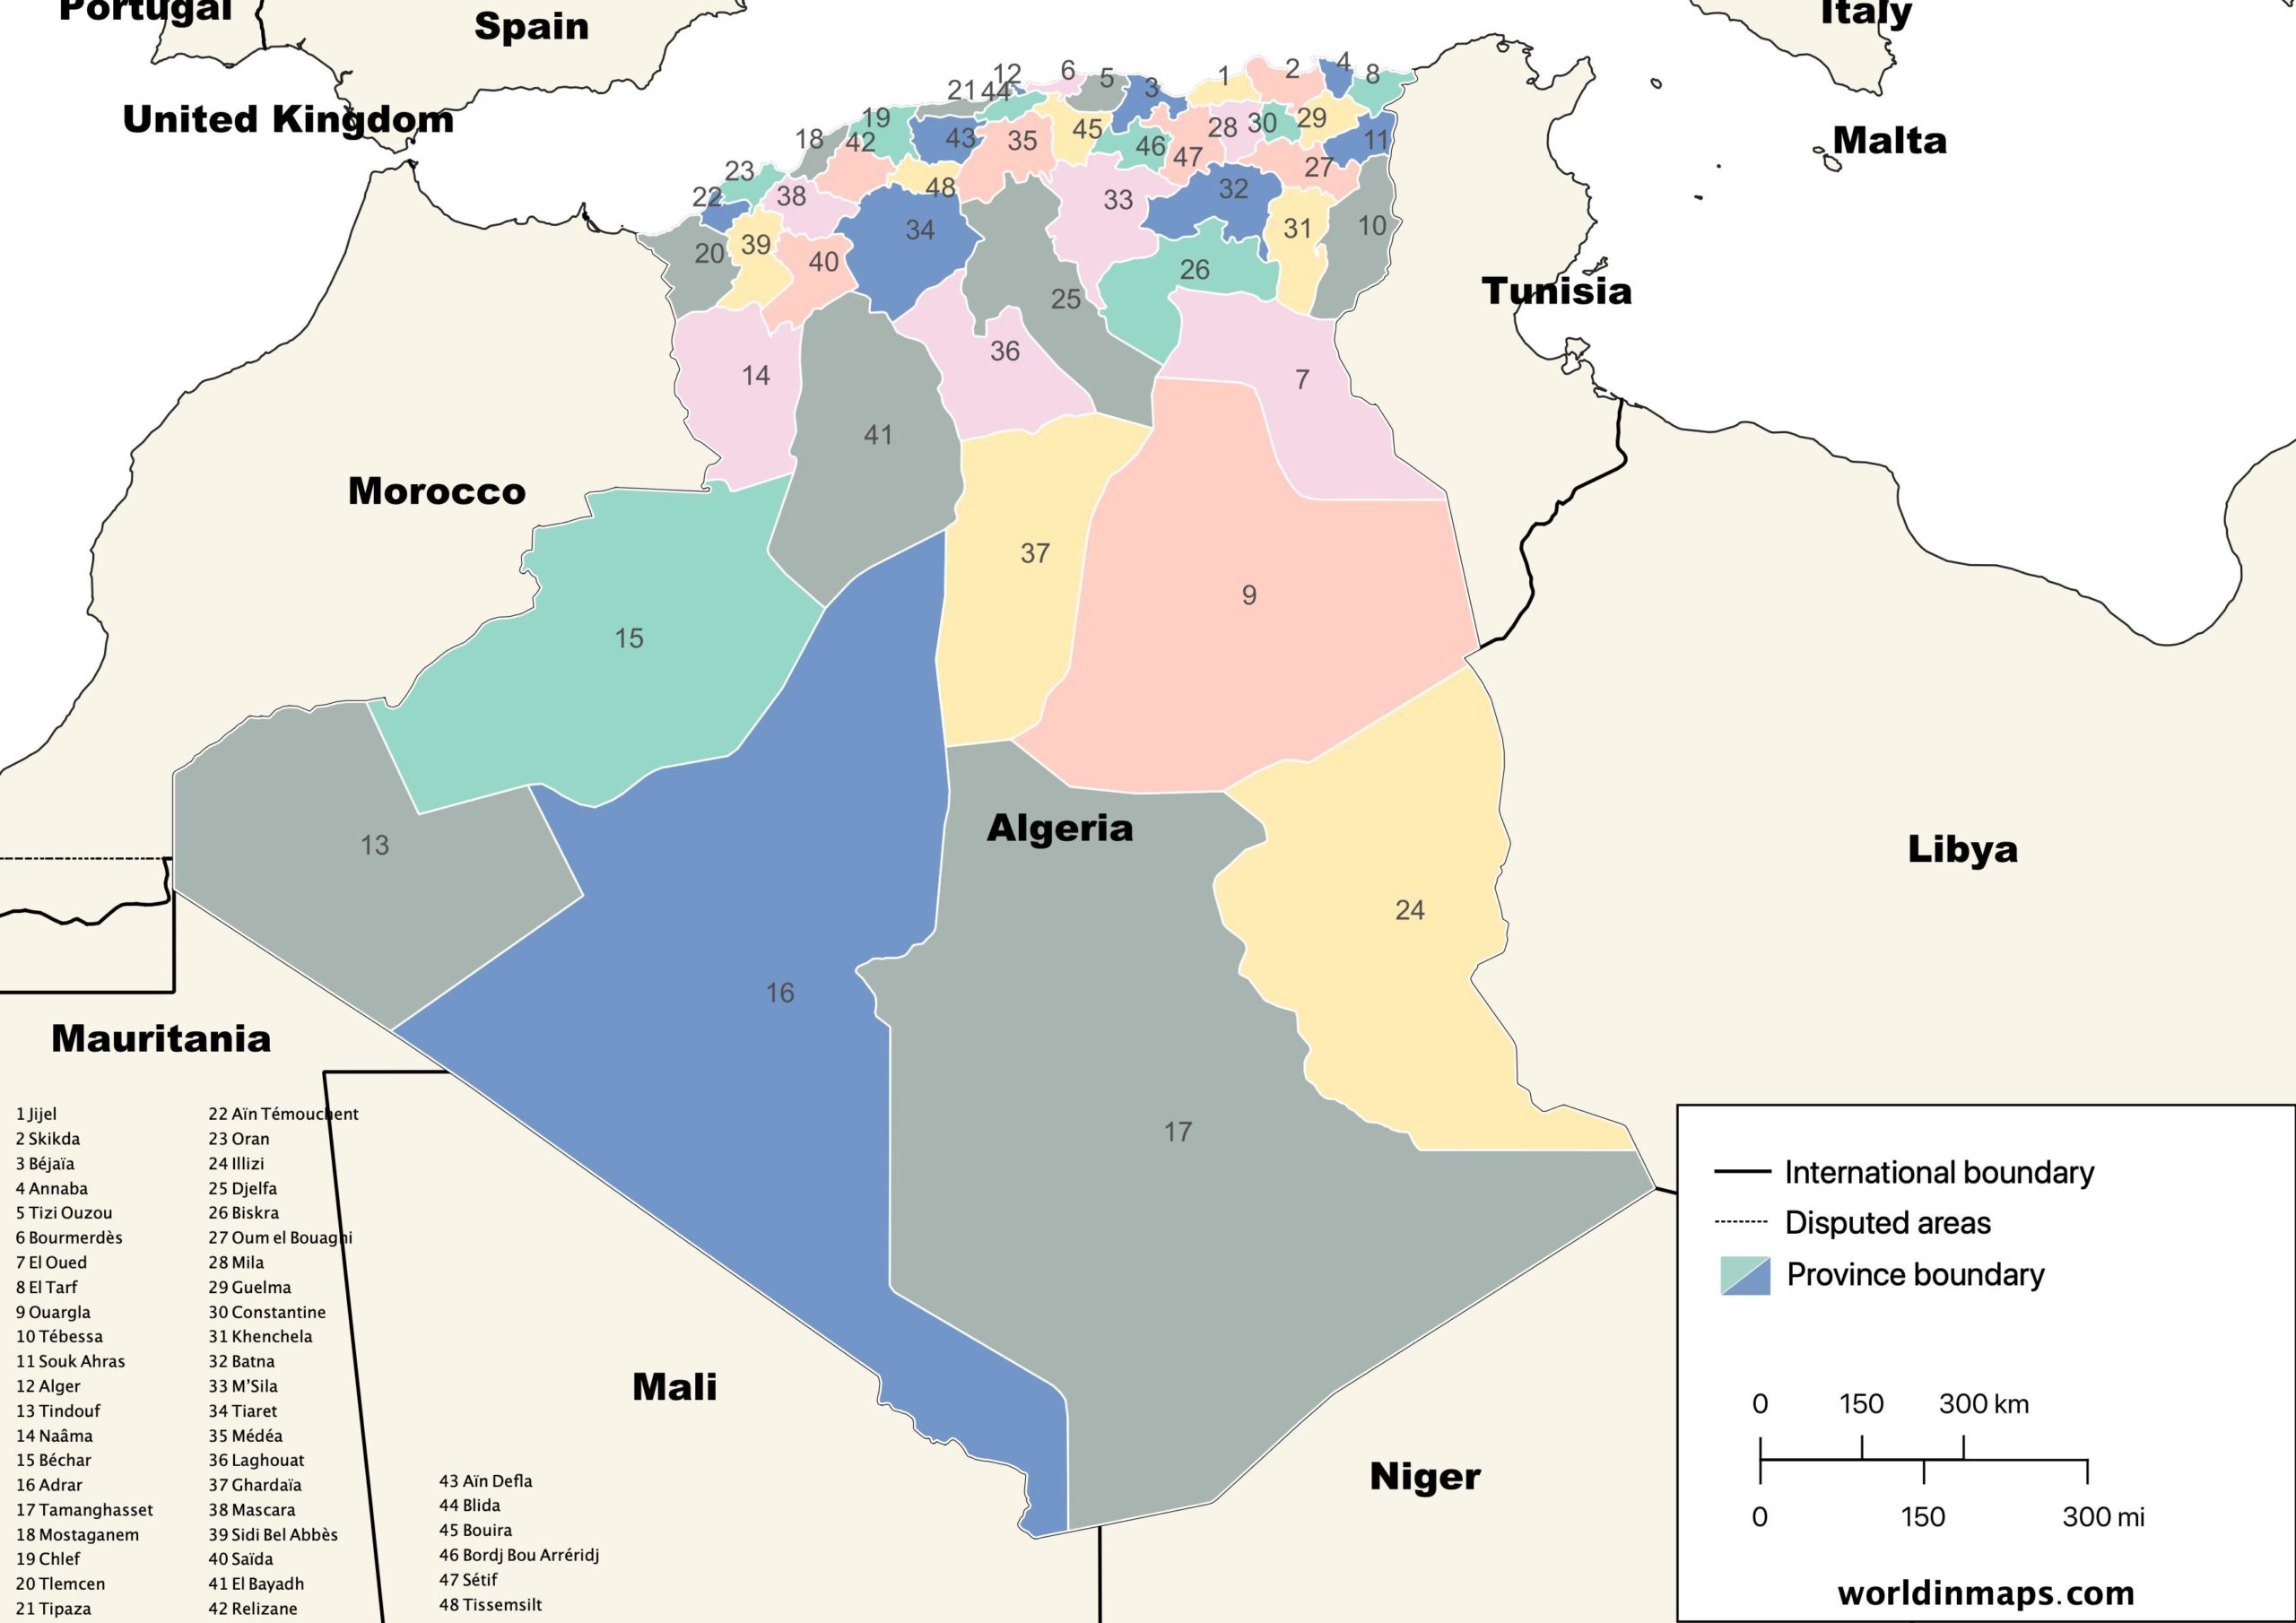
States and political map of Algeria

Algeria is located in northern Africa. It is bordered by the Mediterranean Sea in the north, Morocco and Western Sahara in the west, Mauritania, Mali and Niger to the south, Libya and Tunisia to the east.
Algeria is divided into 48 provinces (wilayas): Adrar, Chlef, Laghouat, Oum El Bouaghi, Batna, Béjaïa, Biskra, Béchar, Blida, Bouïra, Tamanrasset, Tébessa, Tlemcen, Tiaret, Tizi Ouzou, Algiers, Djelfa, Jijel, Sétif, Saïda, Skikda, Sidi Bel Abbès, Annaba, Guelma, Constantine, Médéa, Mostaganem, M’Sila, Mascara, Ouargla, Oran, El Bayadh, Illizi, Bordj Bou Arréridj, Boumerdes, El Taref, Tindouf, Tissemsilt, El Oued, Khenchela, Souk Ahras, Tipaza, Mila, Ain Defla, Naâma, Ain Timouchent, Ghardaia and Relizane.
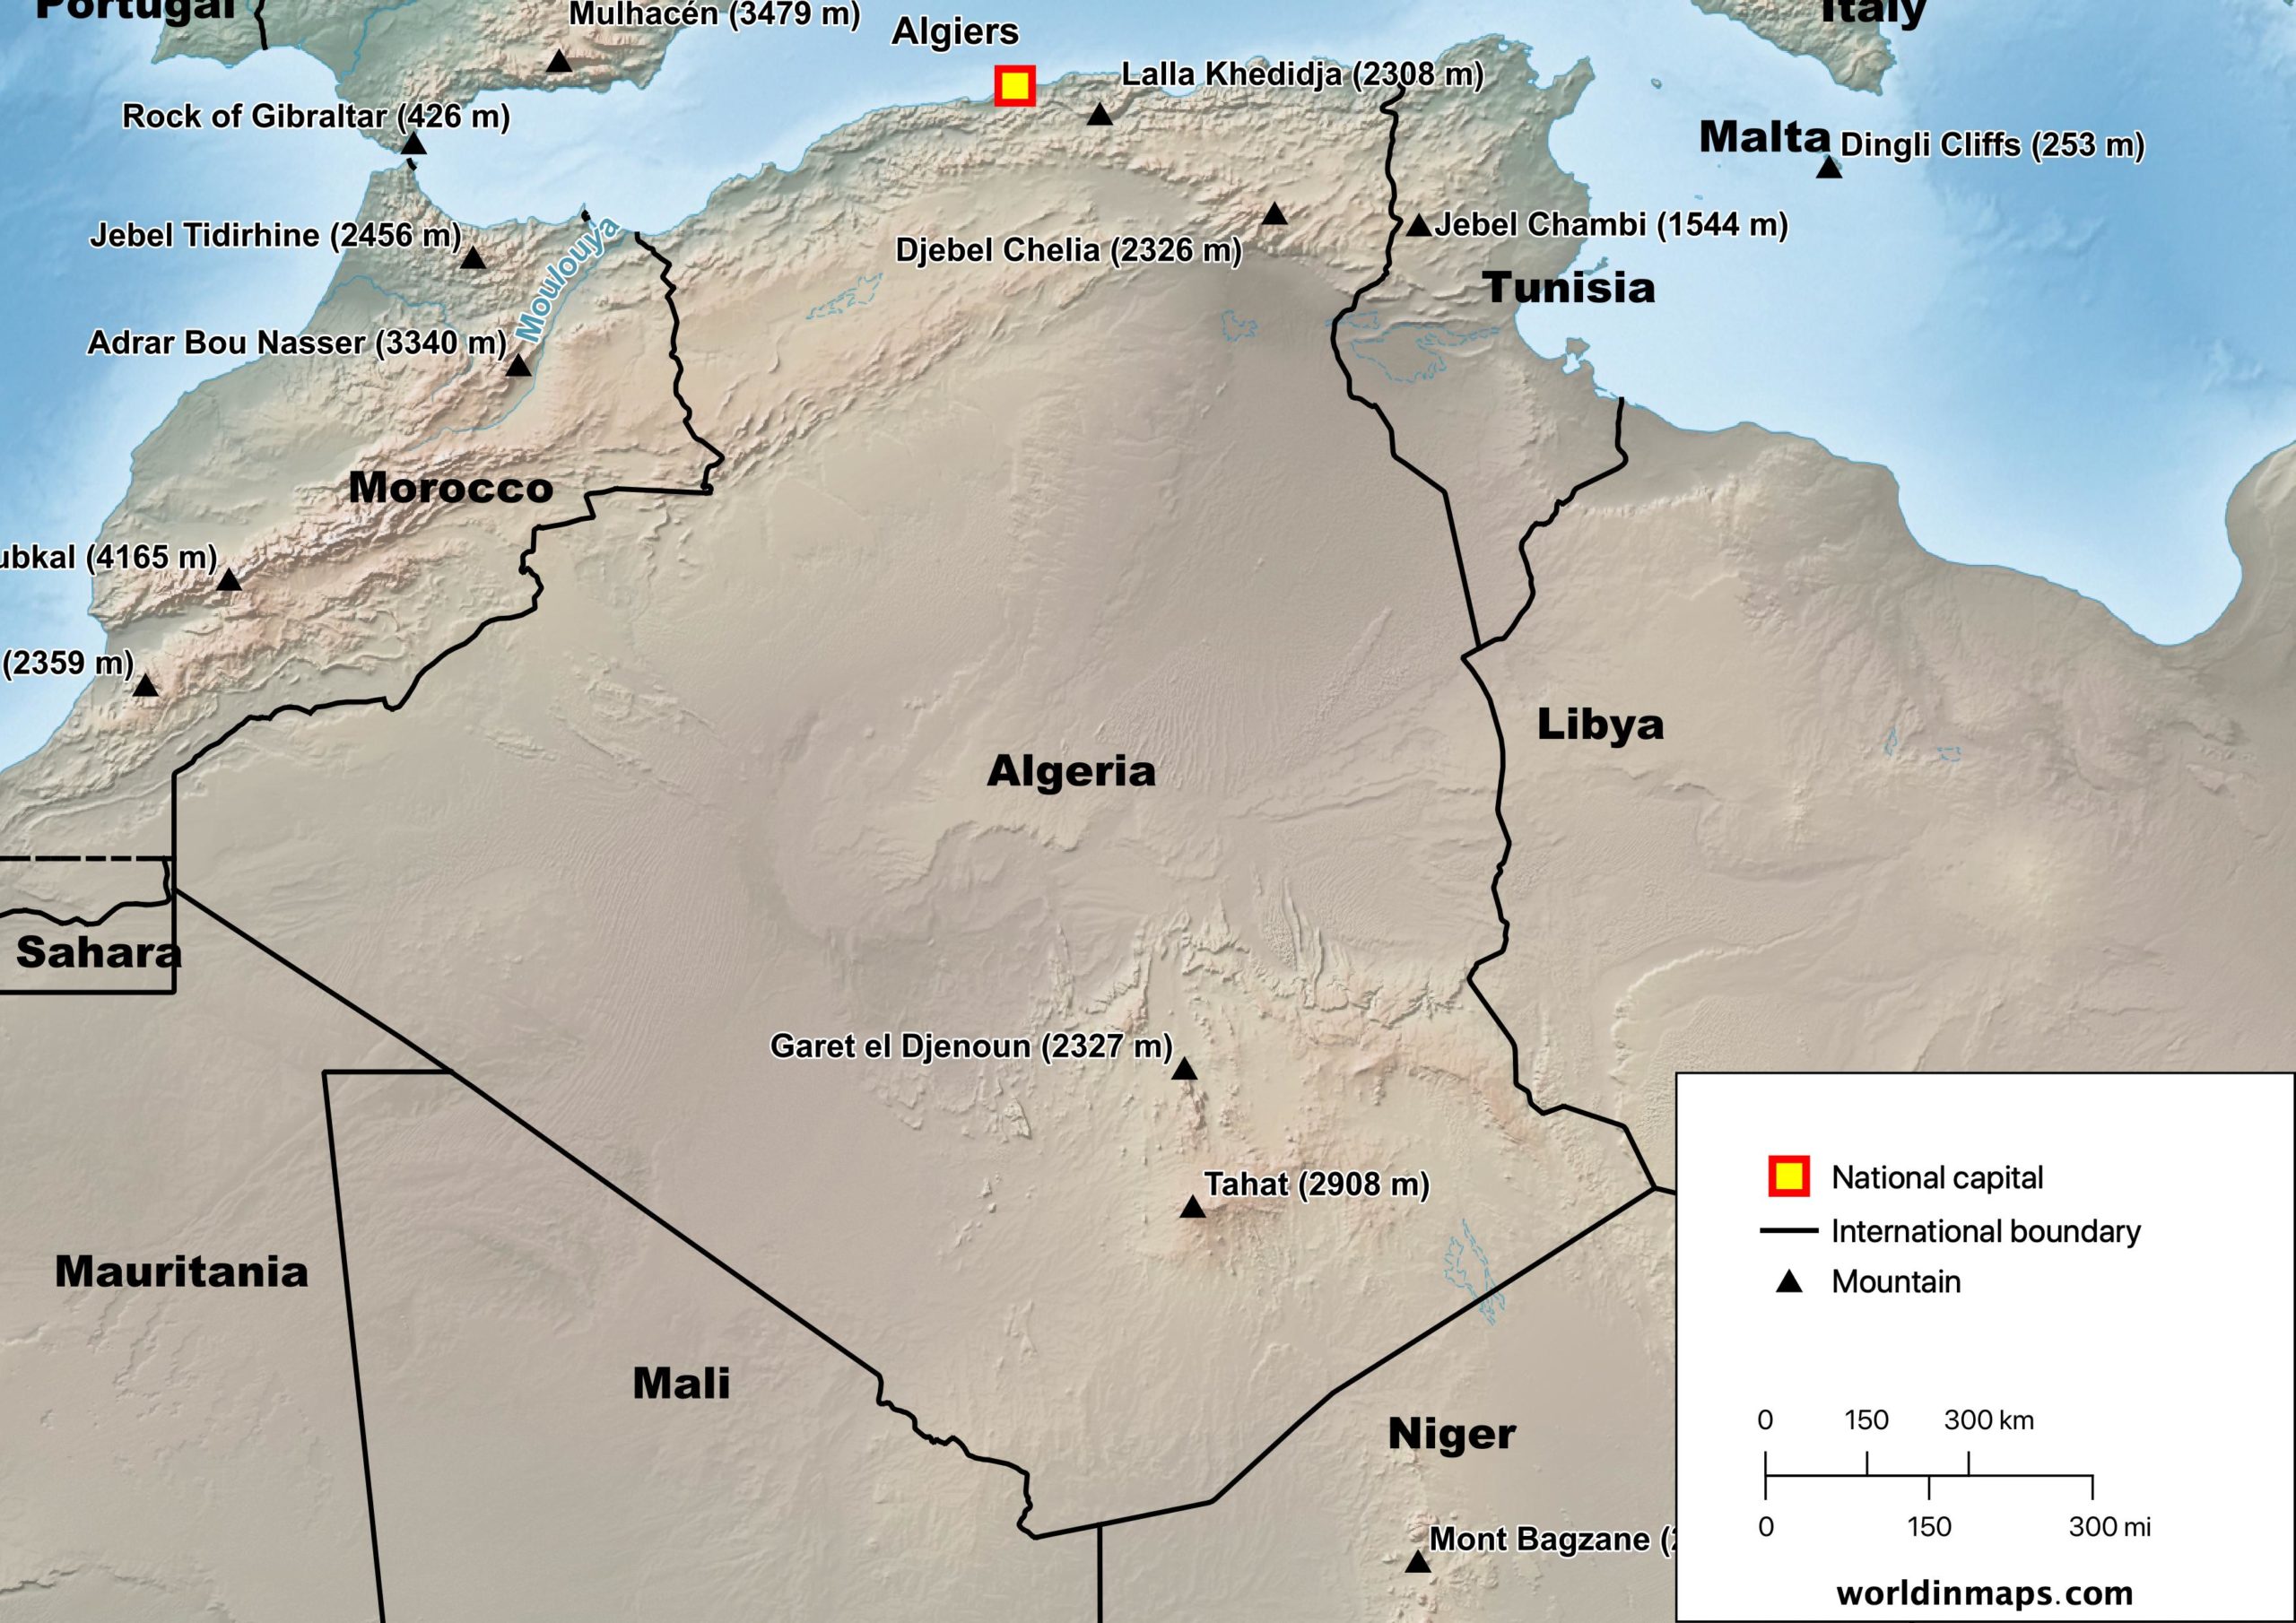
Physical map of Algeria
Cities, airports, ports, railroads, ferries and road map of Algeria
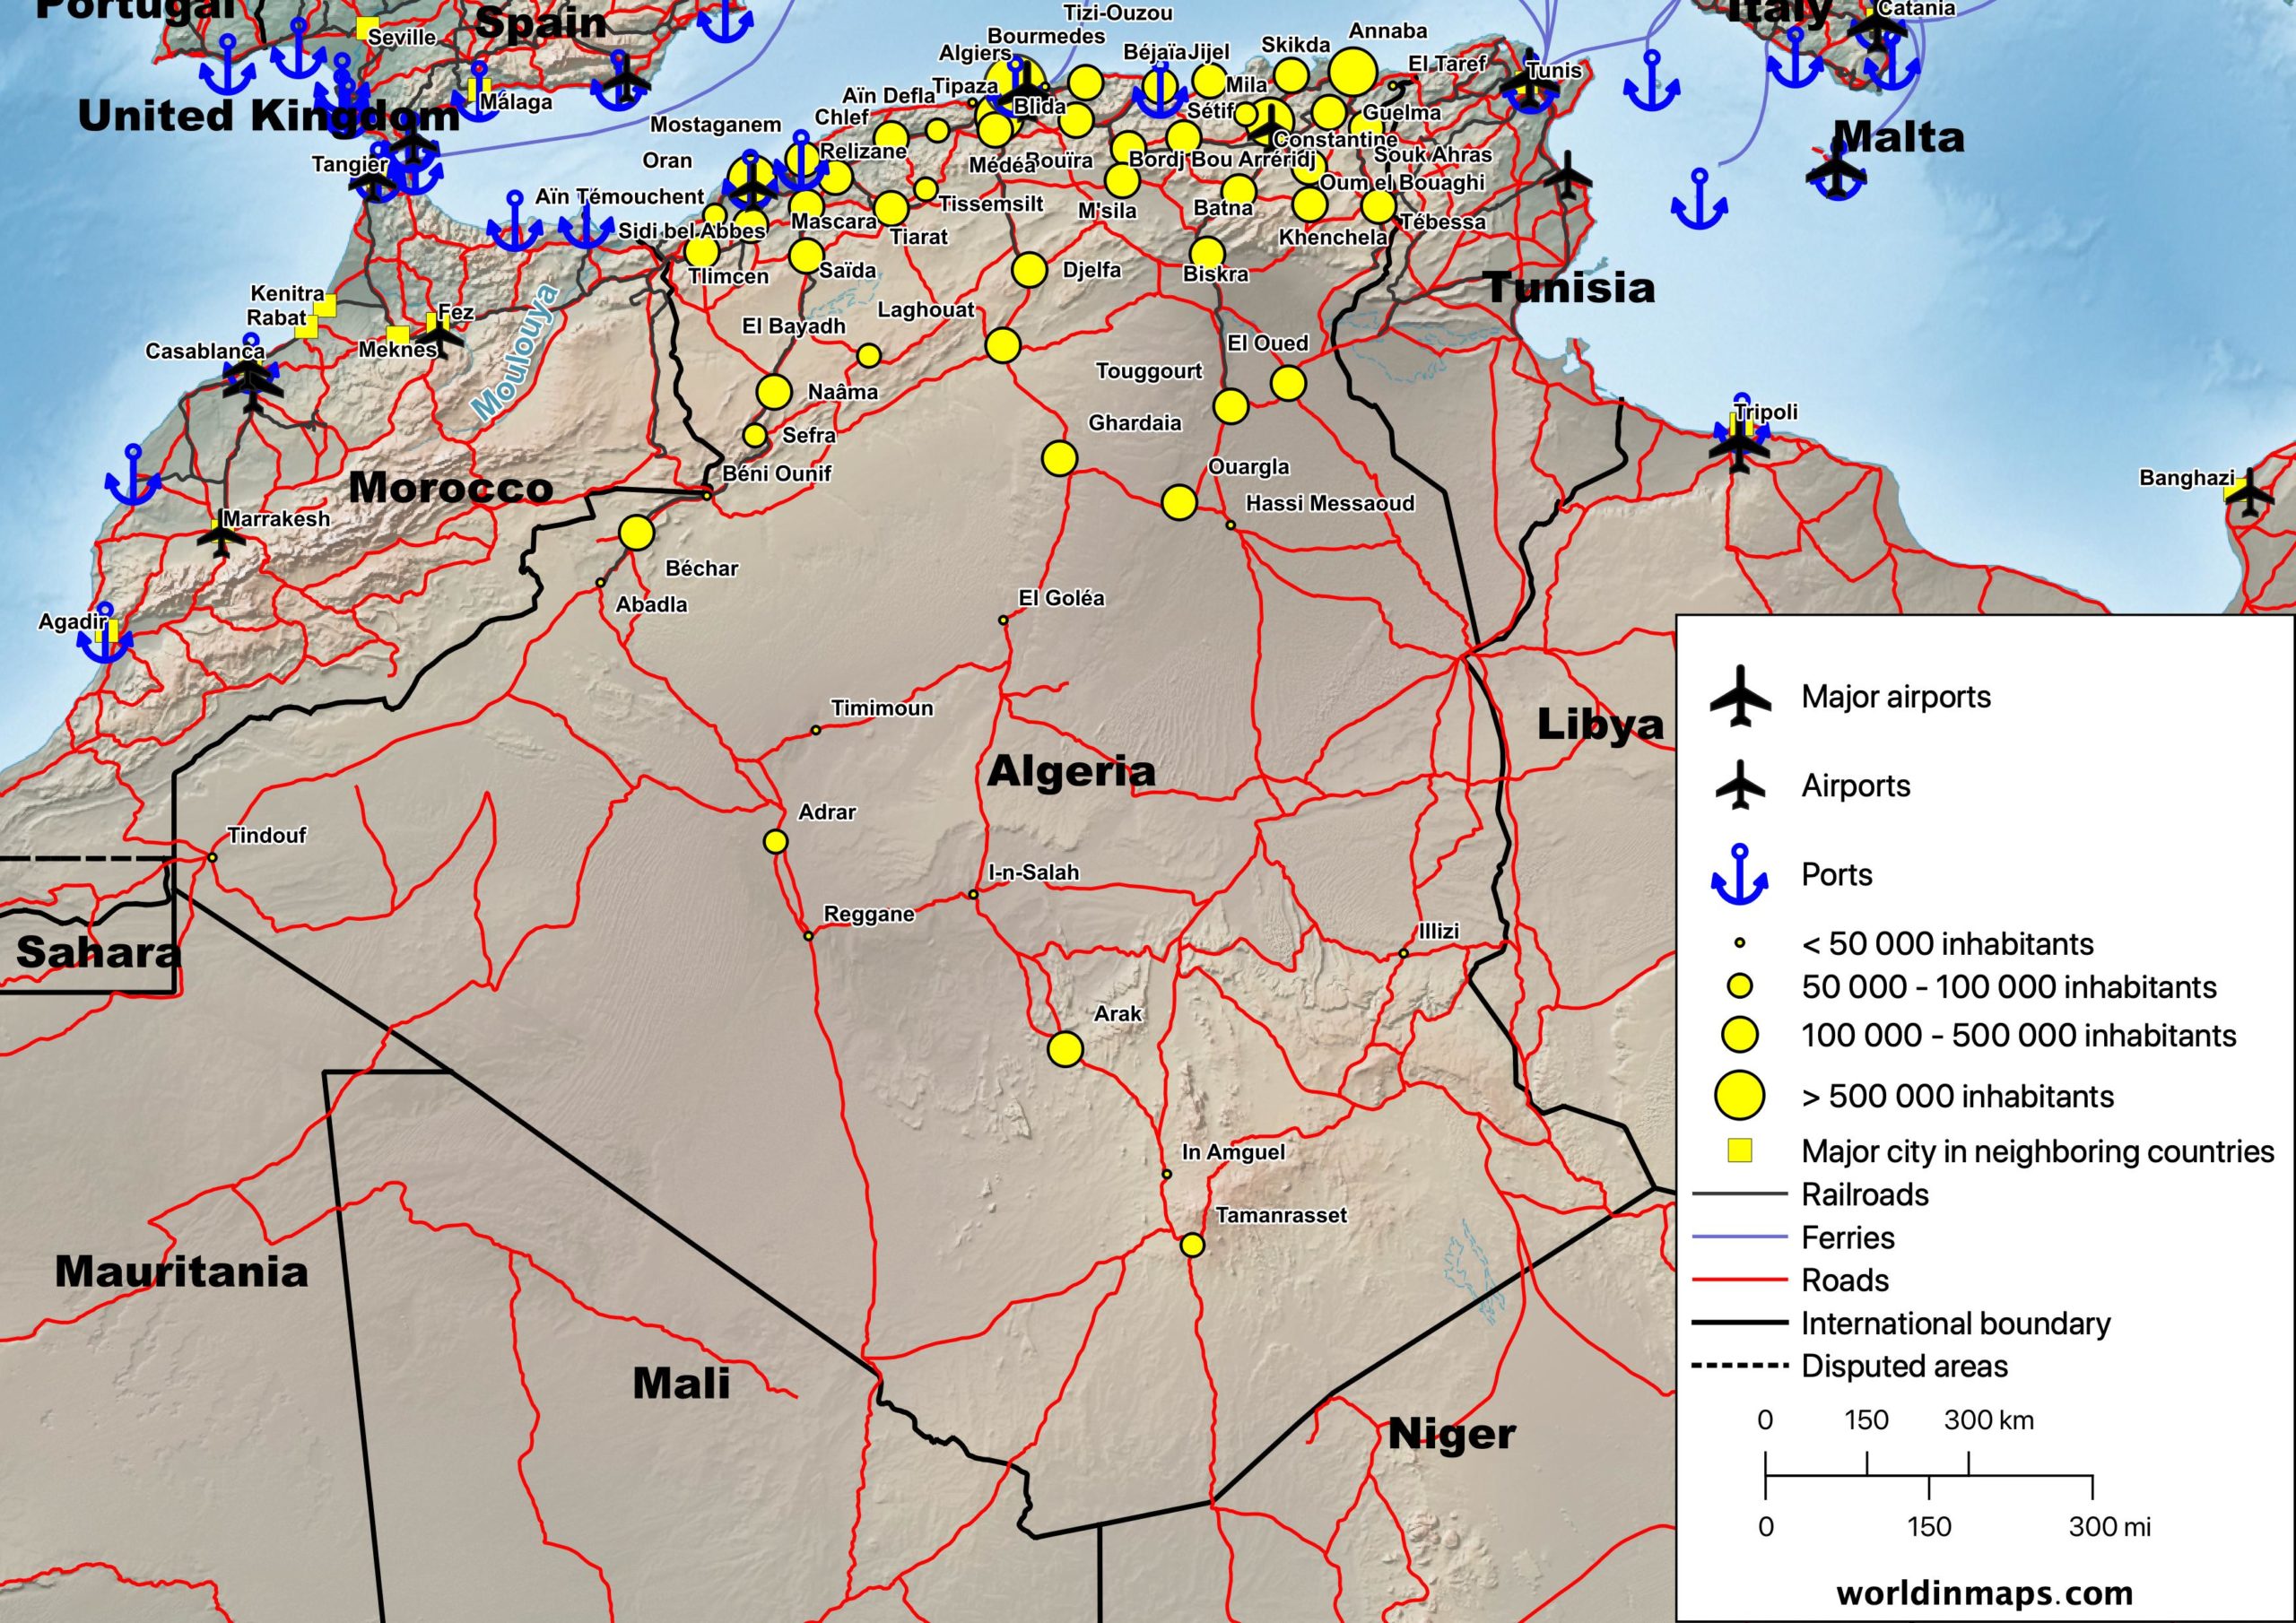
Algeria top 10 largest cities (2008)
- Algiers (2,364,230)
- Oran (803,329)
- Constantine (448,028)
- Annaba (342,703)
- Blida (331,779)
- Batna (289,504)
- Djelfa (265,833)
- Sétif (252,127)
- Sidi Bel Abbès (210,146)
- Biskra (204,661)
Demography
Population pyramid
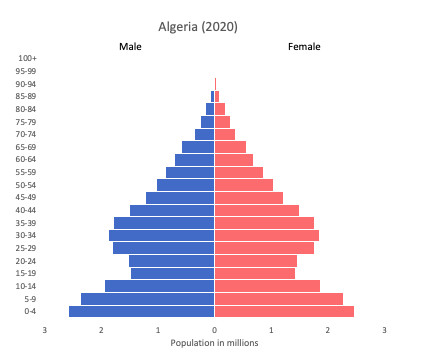
Age structure
Estimation for 2020:
- 0-14 years: 29.58% (male 6,509,490/female 6,201,450)
- 15-24 years: 13.93% (male 3,063,972/female 2,922,368)
- 25-54 years: 42.91% (male 9,345,997/female 9,091,558)
- 55-64 years: 7.41% (male 1,599,369/female 1,585,233)
- 65 years and over: 6.17% (male 1,252,084/female 1,401,357)
Remark: the age structure of a population affects a nation’s key socioeconomic issues. Countries with young populations (high percentage under age 15) need to invest more in schools, while countries with older populations (high percentage ages 65 and over) need to invest more in the health sector. The age structure can also be used to help predict potential political issues. For example, the rapid growth of a young adult population unable to find employment can lead to unrest.
Population from 1950 to 2020
Source: United Nations, Department of Economic and Social Affairs, Population Division (2019). World Population Prospects 2019, Online Edition. Rev. 1.
Evolution of the life expectancy from 1960 to 2018
Source: World Development Indicators, The World Bank
Economy
Agriculture:
wheat, barley, oats, grapes, olives, citrus, fruits, sheep, cattle
Industries:
petroleum, natural gas, light industries, mining, electrical, petrochemical, food processing
Exports – commodities:
petroleum, natural gas, and petroleum products 97% (2009 estimate)
Imports – commodities:
capital goods, foodstuffs, consumer goods
Time in Algeria
Go to our interactive map to get the current time in Algeria.