Brazil
| Government | |
| Name | Federative Republic of Brazil |
| Portuguese | República Federativa do Brasil |
| Government type | Federal presidential republic |
| Capital | Brasília ( 3,015,268 (2019)) |
| Currency | Real (BRL) |
| People | |
| Population (2020) | 212,559,409 (6th) |
| Density of population | 25 P/km2 (200th) |
| Nationality | Brazilian |
| Official languages | |
| Portuguese | |
| Ethnic groups (2010) | |
| White | 47.7% |
| Mulatto (mixed white and black) | 43.1% |
| black | 7.6% |
| Asian | 1.1% |
| Indigenous | 0.4% |
| Religions (2010) | |
| Roman Catholic | 64.6% |
| Other Catholic | 0.4% |
| Protestant | 22.2% |
| Adventist | 6.5% |
| Assembly of God | 2.0% |
| Christian Congregation of Brazil | 1.2% |
| Universal Kingdom of God | 1.0% |
| Other Prostestant | 11.5% |
| Other Christian | 0.7% |
| Spiritist | 2.2% |
| Other | 1.4% |
| None | 8% |
| Unspecified | 0.4% |
| Life expectancy (2020) | |
| Male | 71.2 years |
| Female | 78.4 years |
| Total population | 74.7 years (126th) |
| Homicides | |
| Total (2018) | 27.4 per 100,000 people (14th) |
| Geography | |
| Land area | 8,358,140 km2 |
| water area | 157,630 km2 |
| total area | 8,515,770 km2 (6th) |
| Mean elevation | 320 m |
| Lowest point | |
| Atlantic Ocean | 0 m |
| Highest point | |
| Pico da Neblina | 2,994 m |
| Land use (2011) | |
| Agricultural land | 32.9% |
| Arable land | 8.6% |
| Permanent crops | 0.8% |
| Permanent pasture | 23.5% |
| Forest | 61.9% |
| Other | 5.2% |
| Urbanization | |
| Urban population (2020) | 87.1% |
| Rate of urbanization | 1.05% annual rate of change (2015 – 2020) |
| Economy | |
| Labor force (2017) | 104.2 million (5th) |
| Labor force by occupation (2017) | |
| Agriculture | 9.4% |
| Industry | 32.1% |
| Services | 58.5% |
| Unemployment rate (2017) | 12.8% (165th) |
| GDP (PPP) (estimate 2020) | |
| Total | $3.596 trillion (8th) |
| Per capita | $17,016(80th) |
| GDP (nominal) (estimate 2020) | |
| Total | $1.893 trillion (9th) |
| Per capita | $8,955 (73rd) |
| GDP by sector (estimate 2017) | |
| Agriculture | 6.6% |
| Industry | 20.7% |
| Services | 72.7% |
| Exports (2017) | $217.2 billion (26th) |
| Exports partners (2017) | |
| China | 21.8% |
| US | 12.5% |
| Argentina | 8.1% |
| Netherlands | 4.3% |
| Imports (2017) | $153.2 billion (29th) |
| Imports partners (2017) | |
| China | 18.1% |
| US | 16.7% |
| Argentina | 6.3% |
| Germany | 6.1% |
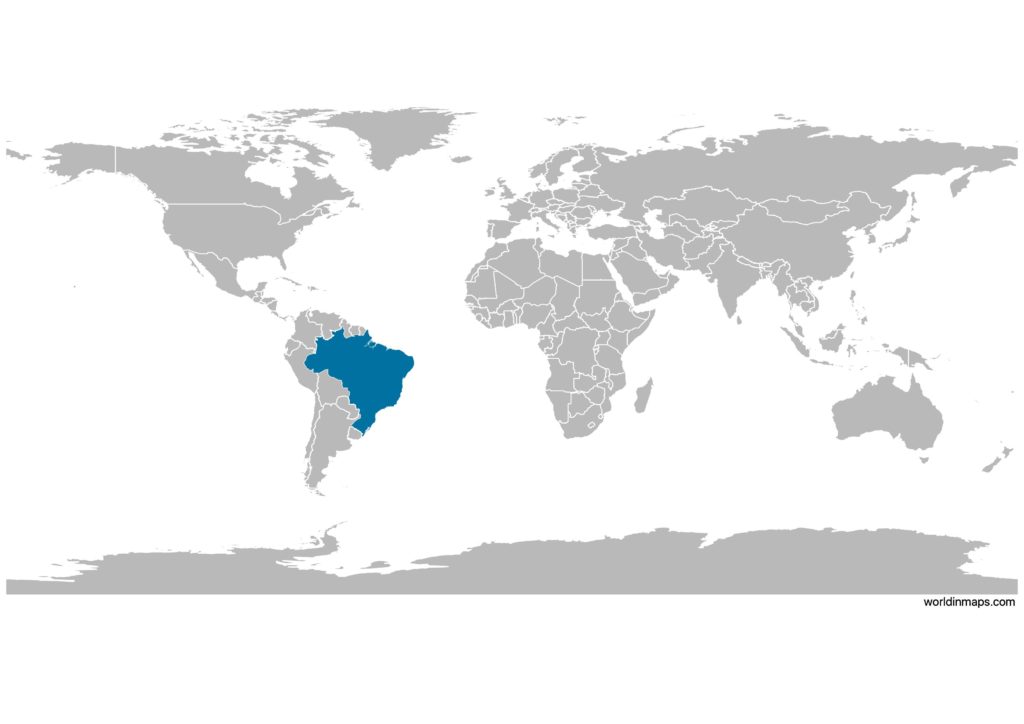
Brazil on the world map
Brazil top 10 largest cities (2019)
- São Paulo (12,252,023)
- Rio de Janeiro (6,718,903)
- Brasília (3,015,268)
- Salvador (2,872,347)
- Fortaleza (2,669,342)
- Belo Horizonte (2,512,070)
- Manaus (2,182,763)
- Curitiba (1,933,105)
- Recife (1,645,727)
- Goiânia (1,516,113)
Demography
Population pyramid
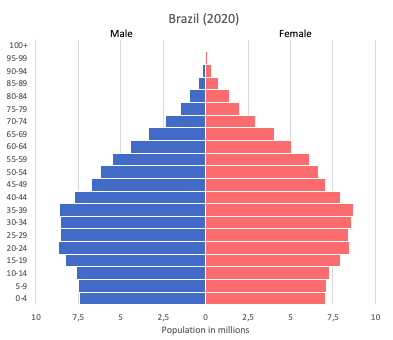
Age structure data
Estimate for 2020:
- 0-14 years: 21.11% (male 22,790,634/female 21,907,018)
- 15-24 years: 16.06% (male 17,254,363/female 16,750,581)
- 25-54 years: 43.83% (male 46,070,240/female 46,729,640)
- 55-64 years: 9.78% (male 9,802,995/female 10,911,140)
- 65 years and over: 9.21% (male 8,323,344/female 11,176,018)
Remark: the age structure of a population affects a nation’s key socioeconomic issues. Countries with young populations (high percentage under age 15) need to invest more in schools, while countries with older populations (high percentage ages 65 and over) need to invest more in the health sector. The age structure can also be used to help predict potential political issues. For example, the rapid growth of a young adult population unable to find employment can lead to unrest.
Population from 1950 to 2020
Source: United Nations, Department of Economic and Social Affairs, Population Division (2019). World Population Prospects 2019, Online Edition. Rev. 1.
Evolution of the life expectancy from 1960 to 2018
Source: World Development Indicators, The World Bank
Economy
Agriculture:
coffee, soybeans, wheat, rice, corn, sugarcane, cocoa, citrus, beef
Industries:
textiles, shoes, chemicals, cement, lumber, iron ore, tin, steel, aircraft, motor vehicles and parts, other machinery and equipment
Exports – commodities:
transport equipment, iron ore, soybeans, footwear, coffee, automobiles
Imports – commodities:
machinery, electrical and transport equipment, chemical products, oil, automotive parts, electronics
Time zone and current time in Brazil
Go to our interactive map to get the current time in Brazil