Argentina

| Government | |
| Name | Argentine Republic |
| Spanish | República Argentina |
| Government type | Presidential republic |
| Capital | Buenos Aires (15,154,(2015)) |
| Currency | Peso (ARS) |
| People | |
| Population (2020) | 45,195,777 (31st) |
| Density of population | 14.4 P/km2 |
| Nationality | Argentine |
| Official languages | |
| Spanish | |
| Ethnic groups (2010) | |
| European (mostly spanish and Italian descent) and mestizo (mixed European and Amerindian ancestry) | 97.2% |
| Amerindian | 2.4% |
| African | 0.4% |
| Religion | |
| nominally Roman Catholic | 92% |
| practicing | < 20% |
| Protestant | 2% |
| Jewish | 2% |
| Other | 4% |
| Life expectancy (2020) | |
| Male | 74.7 years |
| Female | 81.1 years |
| Total population | 77.8 years (74th) |
| Homicides | |
| Total (2018) | 5.3 per 100,000 people (59th) |
| Literacy (2015) | |
| Definition: age 15 and over can read and write | |
| Male | 98.9% |
| Female | 99.1% |
| Total population | 99% |
| Geography | |
| Land area | 2,736,690 km2 |
| water area | 43,710 km2 |
| total area | 2,780,400 km2 (9th) |
| Mean elevation | 595 m |
| Lowest point | |
| Laguna del Carbon | -105 m |
| Highest point | |
| Cerro Aconcagua | 6,962 m |
| Land use (2016) | |
| Agricultural land | 53.9% |
| Arable land | 13.9% |
| Permanent crops | 0.4% |
| Permanent pasture | 39.6% |
| Forest | 10.7% |
| Other | 35.4% |
| Urbanization | |
| Urban population (2020) | 92.1% |
| Rate of urbanization | 1.07% annual rate of change (2015 – 2020) |
| Economy | |
| Labor force (2017 – urban areas only) | 18,000,000 (33rd) |
| Agriculture | 5.3% |
| Industry | 28.6% |
| Services (2017 estimate) | 66.1% |
| Unemployment rate (2014) | 8.4% (120th) |
| GDP (PPP) (estimate 2019) | |
| Total | $903.542 billion (25th) |
| Per capita | $20,055 (56th) |
| GDP (nominal) (estimate 2019) | |
| Total | $445.469 billion (30th) |
| Per capita | $9,887 (53rd) |
| GDP by sector (estimate 2017) | |
| Agriculture | 10.8% |
| Industry | 28.1% |
| Services | 61.1% |
| Exports (2017) | $58.45 billion (49th) |
| Exports partners (2017) | |
| Brazil | 16.1% |
| US | 7.9% |
| China | 7.5% |
| Chile | 4.4% |
| Imports (2017) | $63.97 billion (48th) |
| Imports partners (2017) | |
| Brazil | 26.9% |
| China | 18.5% |
| US | 11.3% |
| Germany | 4.9% |
Argentina on the world map
Argentina top 10 largest cities (2015)
- Buenos Aires (3,054,000)
- Córdoba (1,519,000)
- Rosario (1,429,000)
- Mendoza (1,082,000)
- San Miguel de Tucumán (868,000)
- La Plata (836,000)
- Mar del Plata (633,000)
- Salta (625,000)
- Santa Fe (530,000)
- San Juan (513,000)
Demography
Population pyramid data for 2020
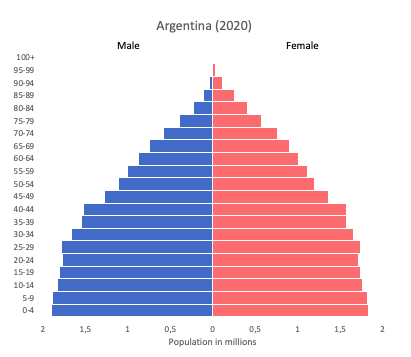
Age structure data for 2020
Estimate for 2020:
- 0-14 years: 24.02% (male 5,629,188/female 5,294,723)
- 15-24 years: 15.19% (male 3,539,021/female 3,367,321)
- 25-54 years: 39.6% (male 9,005,758/female 9,002,931)
- 55-64 years: 9.07% (male 2,000,536/female 2,122,699)
- 65 years and over: 12.13% (male 2,331,679/female 3,185,262)
Remark: the age structure of a population affects a nation’s key socioeconomic issues. Countries with young populations (high percentage under age 15) need to invest more in schools, while countries with older populations (high percentage ages 65 and over) need to invest more in the health sector. The age structure can also be used to help predict potential political issues. For example, the rapid growth of a young adult population unable to find employment can lead to unrest.
Population from 1950 to 2020
Source: United Nations, Department of Economic and Social Affairs, Population Division (2019). World Population Prospects 2019, Online Edition. Rev. 1.
Evolution of the life expectancy from 1960 to 2018
Source: World Development Indicators, The World Bank
Economy
Agriculture:
sunflower seeds, lemons, soybeans, grapes, corn, tobacco, peanuts, tea, wheat, livestock
Industries:
food processing, motor vehicles, consumer durables, textiles, chemicals and petrochemicals, printing, metallurgy, steel
Exports – commodities:
soybeans and derivatives, petroleum and gas, vehicles, corn, wheat
Imports – commodities:
machinery, motor vehicles, petroleum and natural gas, organic chemicals, plastics
Time zone and current time in Argentina
Go to our interactive map to get the current time in Argentina