Afghanistan
| Government | |
| Name | Islamic Republic of Aghanistan |
| Pashto | د أفغانستان اسلامي جمهوریت Da Afġānistān Islāmī Jomhouriyet |
| Dari | جمهوری اسلامی أفغانستان Jomhūrī-ye Eslāmī-ye Afġānestān |
| Government type | Presidential Islamic republic |
| Capital | Kabul (4,273,200 (2020)) |
| Currency | Afghani (AFN) |
| Organization | |
| Member State | South Asian Association for Regional Cooperation (SAARC) |
| Observer State | Commonwealth of Independent States (CIS) |
| People | |
| Population (2020) | 38,928,346 (39th) |
| Density of population | 60 P/km2 |
| Nationality | Afghan |
| Official languages1 | |
| Dari | 77% |
| Pashto | 48% |
| Ethnic groups | |
| Pashtun | 42% |
| Tajik | 27% |
| Hazara | 9% |
| Uzbek | 9% |
| Aimaq | 4% |
| Turkmen | 3% |
| Baloch | 2% |
| Others | 4% |
| Religion | |
| Muslim | 99.7% |
| Sunni | 84.7 – 89.7% |
| Shia | 10 – 15%) |
| Other | 0.3% |
| Life expectancy (2020) | |
| Male | 51.4 years |
| Female | 54.4 years |
| Total population | 52.8 years (228th) |
| Homicides | |
| Total (2018) | 6.7 per 100,000 people (49th) |
| Literacy | |
| Definition: age 15 and over can read and write | |
| Male | 55.5% |
| Female | 29.8% |
| Total population | 43% |
| Geography | |
| Land area | 652,230 km2 |
| water area | 0 km2 |
| total area | 652,230 km2 (42th) |
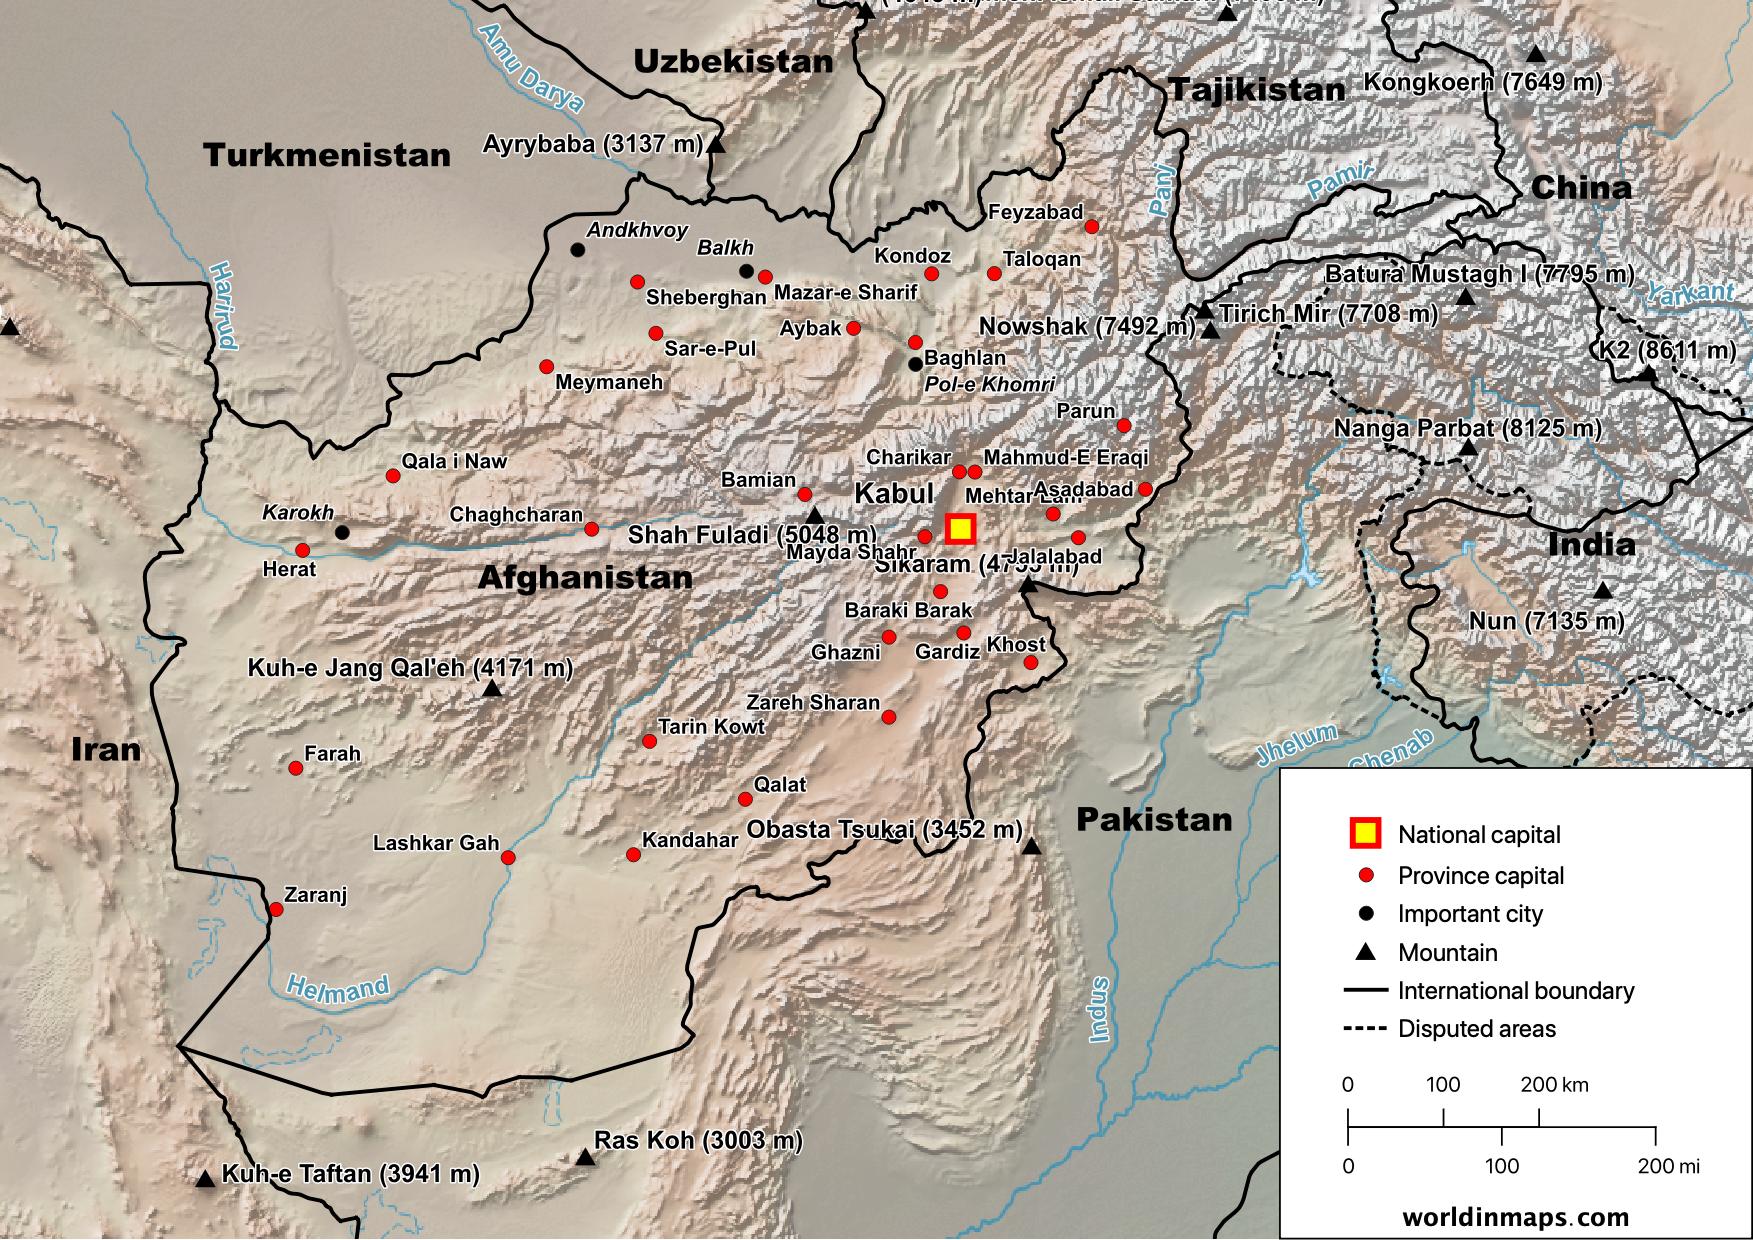
| Mean elevation | 1,884 m |
| Lowest point | |
| Amu Darya | 258 m |
| Highest point | |
| Noshak | 7,492 m |
| Land use (2016) | |
| Agricultural land | 58.1% |
| Arable land | 11.8% |
| Permanent crops | 0.3% |
| Permanent pasture | 46% |
| Forest | 2.07% |
| Other | 39% |
| Urbanization | |
| Urban population (2020) | 26% |
| Rate of urbanization | 3.37% annual rate of change (2015 – 2020) |
| Economy | |
| Labor force (2017) | 8.478 million (61th) |
| Agriculture | 44.3% |
| Industry | 18.1% |
| Services | 37.6% |
| Unemployment rate (2017) | 23.9% (194th) |
| GDP (PPP) (estimate 2018) | |
| Total | $72.911 billion (96th) |
| Per capita | $2,024 (169th) |
| GDP (nominal) (estimate 2018) | |
| Total | $21.657 billion (111st) |
| Per capita | $601 (177th) |
| GDP by sector (estimate 2016) | |
| Agriculture | 23% |
| Industrie | 21.1% |
| Services | 55.9% |
| Exports (2017) | $784 million (170th) |
| Exports partners (2017) | |
| India | 56.5% |
| Pakistan | 29.6% |
| Imports (2017) | $7.616 billion (113th) |
| Imports partners (2017) | |
| China | 21% |
| Iran | 20.5% |
| Pakistan | 11.8% |
| Kazakhstan | 11% |
| Uzbekistan | 6.8% |
| Malaysia | 5.3% |
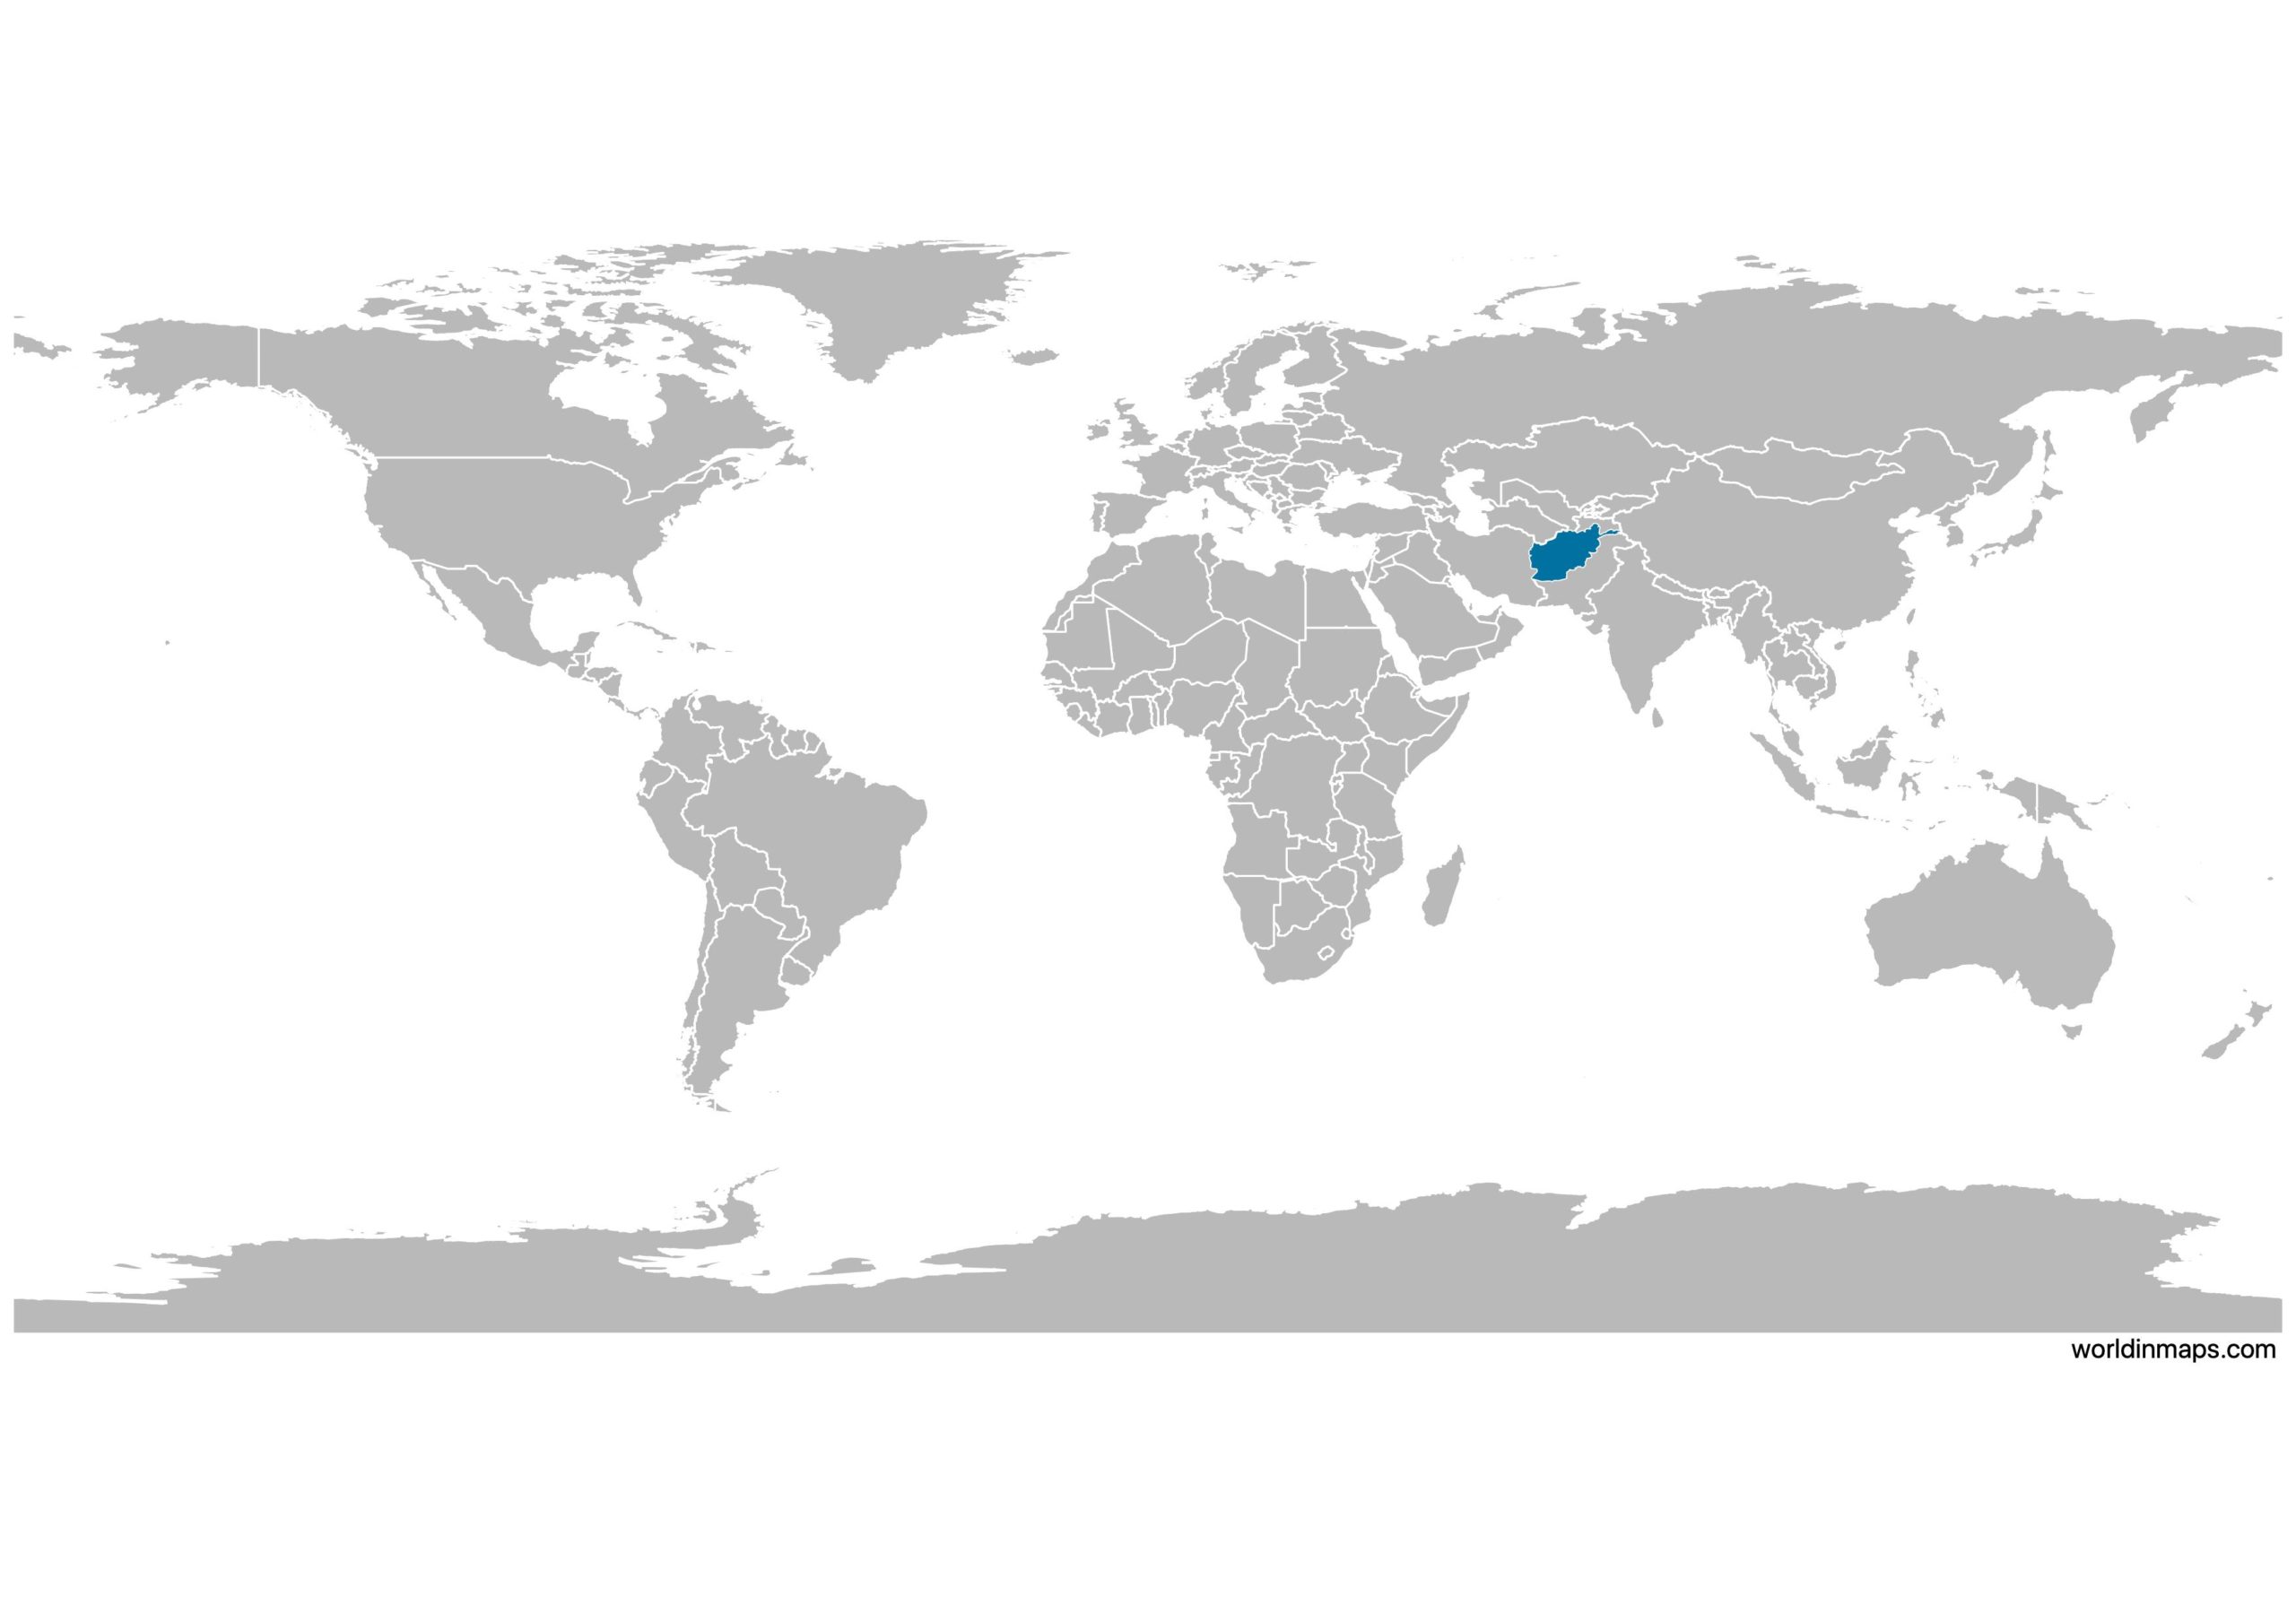
Afghanistan on the world map
States and political map of Afghanistan
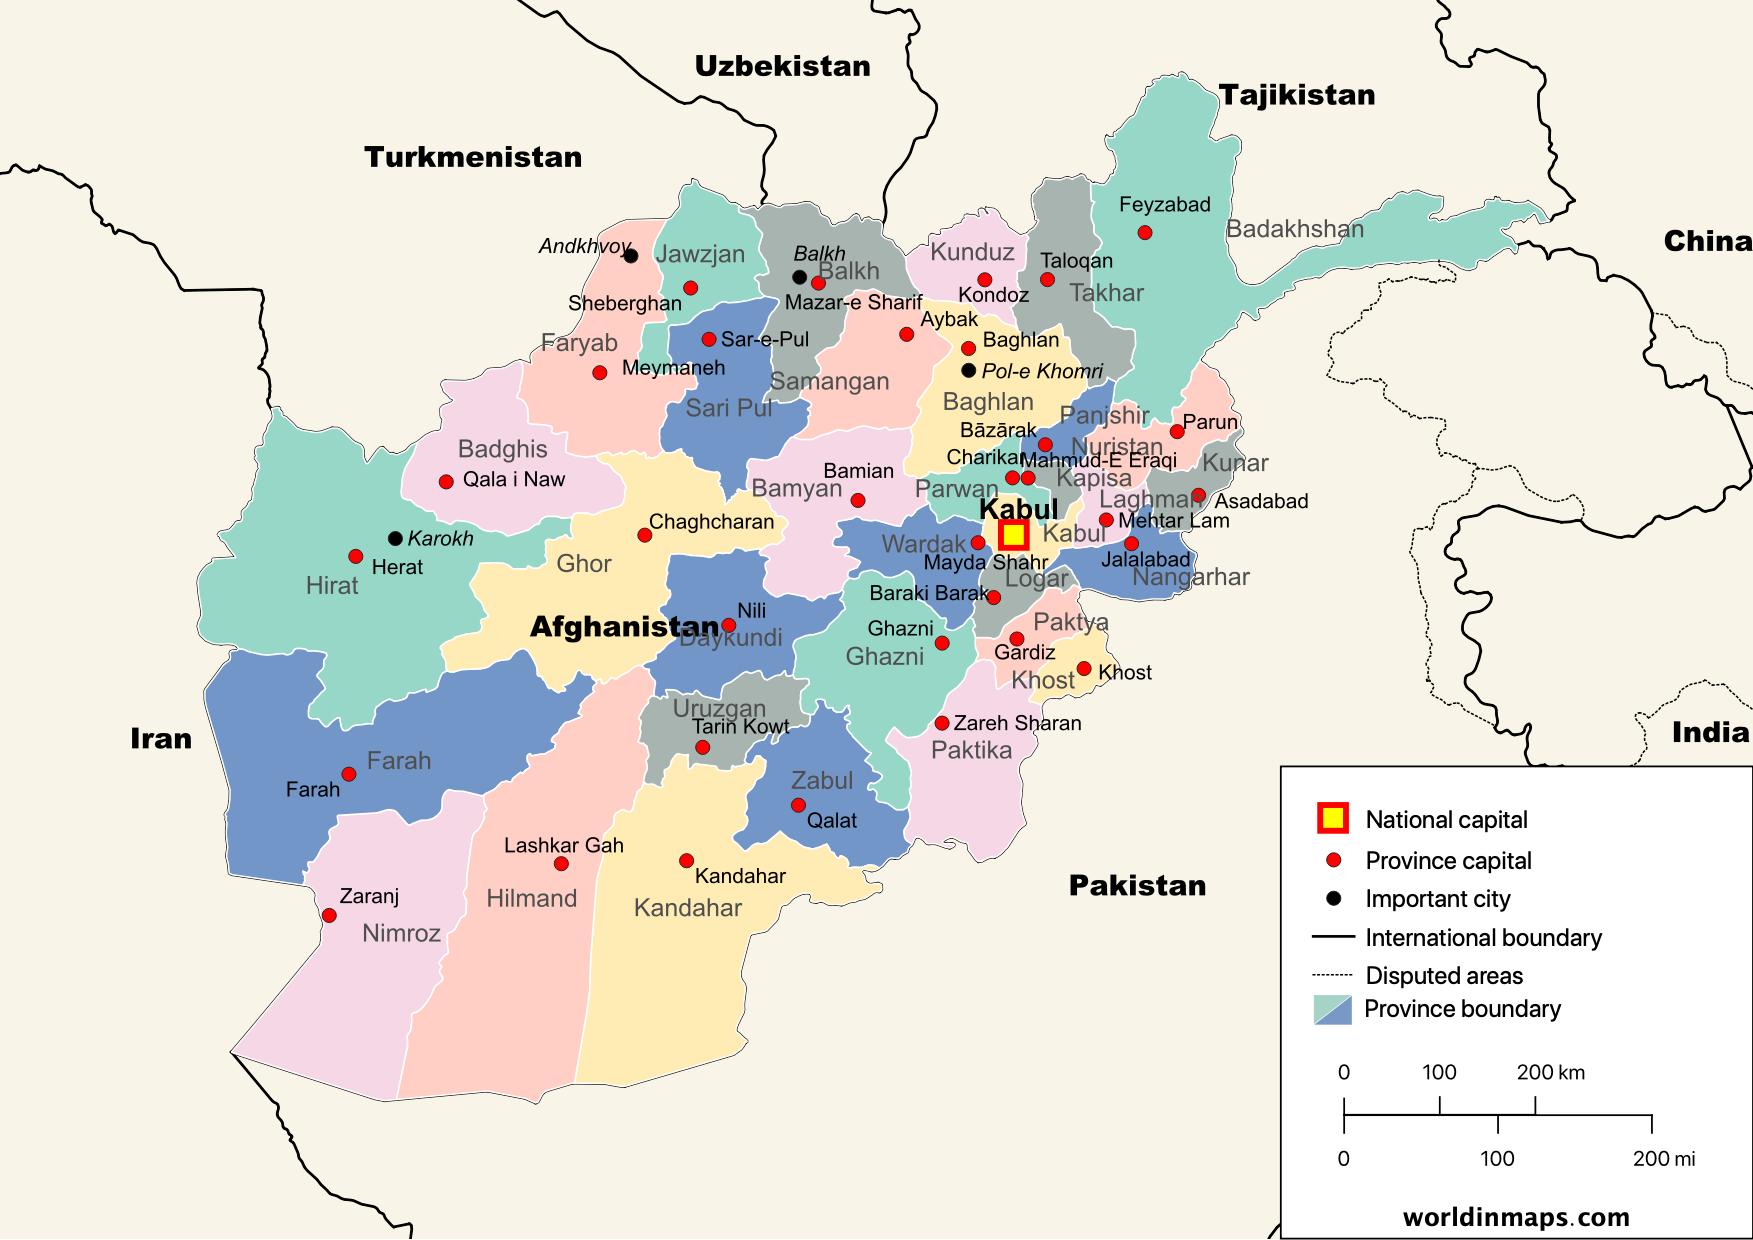
Afghanistan is a landlocked country. It is bordered by Tajikistan, Uzbekistan, and Turkmenistan to the north, Iran to the west, and Pakistan to the south and east. Finally, a little part of the east is in contact with China.
Afghanistan has 34 provinces (welayat, singular – welayat): Badakhshan, Badghis, Baghlan, Balkh, Bamyan, Daykundi, Farah, Faryab, Ghazni, Ghor, Helmand, Herat, Jowzjan, Kabul, Kandahar, Kapisa, Khost, Kunar, Kunduz, Laghman, Logar, Nangarhar, Nimroz, Nuristan, Paktika, Paktiya, Panjshir, Parwan, Samangan, Sar-e Pul, Takhar, Uruzgan, Wardak, Zabul.
Physical map of Afghanistan
Cities, Railroads and road map of Afghanistan
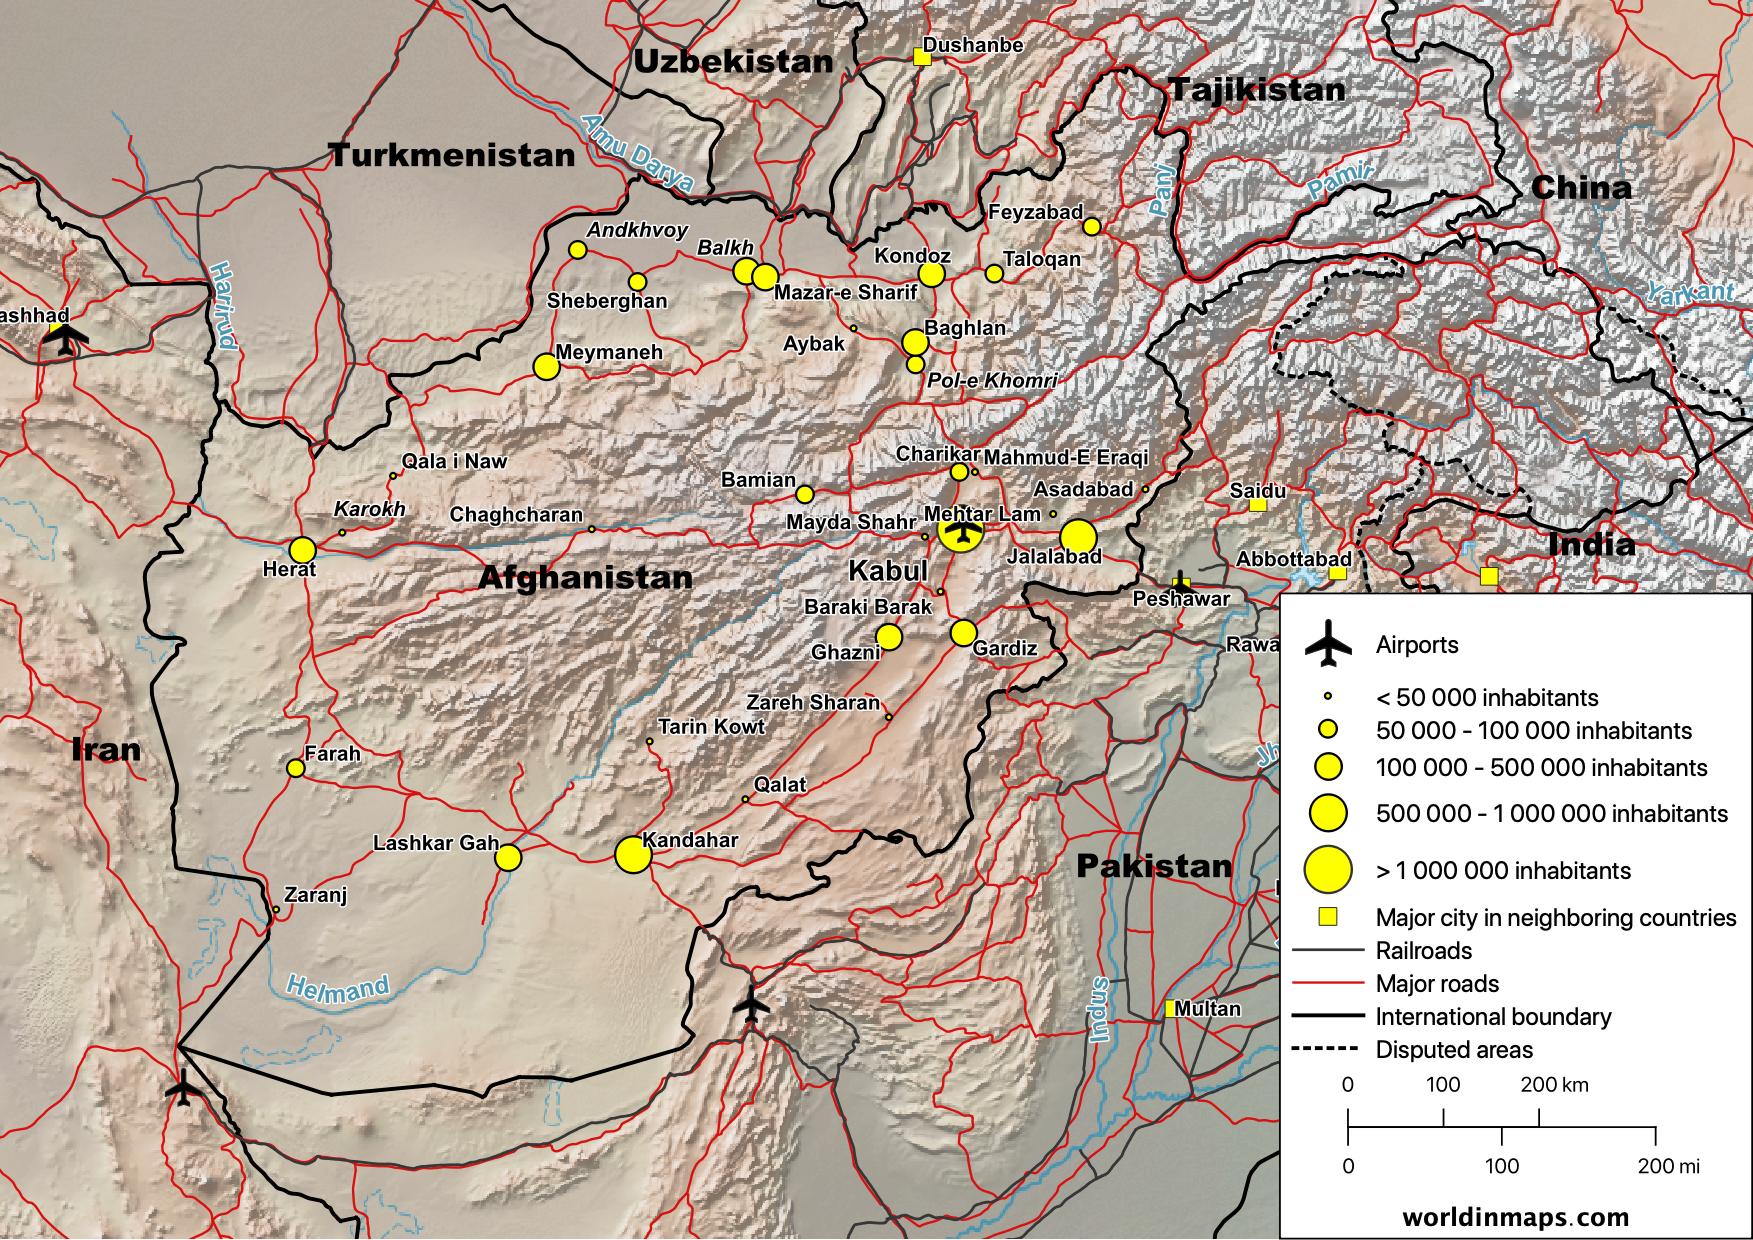
Afghanistan top 10 largest cities (2019)
- Kabul: 4,273,200
- Kandahar: 614,300
- Herat: 556,200
- Mazar-i-Sharif: 469,200
- Kunduz: 356,500
- Jalalabad: 263,200
- Taloqan: 253,700
- Puli Khumri: 237,900
- Ghazni: 183,000
- Khost: 153,300
Demography
Population pyramid
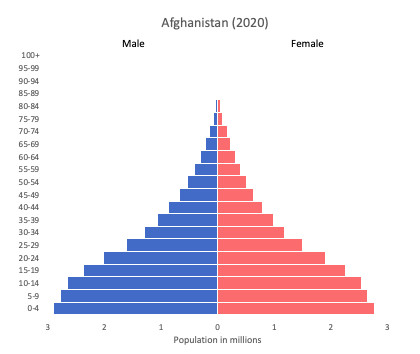
Age structure
Estimation for 2020:
- 0-14 years (children): 40.62% (male 7,562,703/female 7,321,646)
- 15-24 years (early working age): 21.26% (male 3,960,044/female 3,828,670)
- 25-54 years (prime working age): 31.44% (male 5,858,675/female 5,661,887)
- 55-64 years (mature working age): 4.01% (male 724,597/female 744,910)
- 65 years and over (elderly): 2.68% (male 451,852/female 528,831)
Remark: the age structure of a population affects a nation’s key socioeconomic issues. Countries with young populations (high percentage under age 15) need to invest more in schools, while countries with older populations (high percentage ages 65 and over) need to invest more in the health sector. The age structure can also be used to help predict potential political issues. For example, the rapid growth of a young adult population unable to find employment can lead to unrest.
Population from 1950 to 2020
Source: United Nations, Department of Economic and Social Affairs, Population Division (2019). World Population Prospects 2019, Online Edition. Rev. 1.
Evolution of the life expectancy from 1960 to 2018
Source: World Development Indicators, The World Bank
Economy
Agriculture:
opium, wheat, fruits, nuts, wool, mutton, sheepskins, lambskins, poppies
Industries:
small-scale production of bricks, textiles, soap, furniture, shoes, fertilizer, apparel, food products, non-alcoholic beverages, mineral water, cement; handwoven carpets; natural gas, coal, copper
Exports – commodities:
opium, fruits and nuts, handwoven carpets, wool, cotton, hides and pelts, precious and semi-precious gems, and medical herbs
Imports – commodities:
machinery and other capital goods, food, textiles, petroleum products
Time in Afghanistan
Go to our interactive map to get the current time in Afghanistan.
Source:
- CIA World Factbook
- United Nations, Department of Economic and Social Affairs, Population Division. World Population Prospects: The 2019 Revision. (Medium variant)
- Wikipedia
1 data represent most widely spoken languages; shares sum to more than 100% because there is much bilingualism in the country and because respondents were allowed to select more than one language