Malaysia

| Government | |
| Name | Malaysia |
| Malay | Malaysia |
| Government type | federal parliamentary constitutional monarchy |
| Capital | Kuala Lumpur (1,588,750 (2010)) |
| Currency | Ringgit (MYR) |
| Organization | |
| Member State | Commonwealth of Nations |
| People | |
| Population (2020) | 32,365,998 (43rd) |
| Density of population | 92 P/km2 (116th) |
| Nationality | Malaysian |
| Official languages | |
| Malay | |
| Ethnic groups (2018) | |
| Bumiputera (Malay, Orang Asli, indigenous groups of Sabah and Sarawak) | 68.8% |
| Chinese | 23.2% |
| Indian | 7.0% |
| others | 1.0% |
| Religions (2010) | |
| Muslim (official) | 61.3% |
| Buddhist | 19.8% |
| Christian | 9.2% |
| Hindu | 6.3% |
| Confucianism, Taoism, other traditional Chinese religions | 1.3% |
| other | 0.4% |
| none | 0.8% |
| unspecified | 1% |
| Life expectancy (2020) | |
| Male | 73 years |
| Female | 78.9 years |
| Total population | 75.9 years (108th) |
| Homicides | |
| Total (2013) | 2.1 per 100,000 people (105th) |
| Geography | |
| Land area | 328,657 km2 |
| water area | 1,190 km2 |
| total area | 329,847 km2 (68th) |
| Mean elevation | 419 m |
| Lowest point | |
| Indian Ocean | 0 m |
| Highest point | |
| Gunung Kinabalu | 4,095 m |
| Land use (2011) | |
| Agricultural land | 23.2% |
| Arable land | 2.9% |
| Permanent crops | 19.4% |
| Permanent pasture | 0.9% |
| Forest | 62% |
| Other | 14.8% |
| Urbanization | |
| Urban population (2020) | 77.2% |
| Rate of urbanization | 2.13% annual rate of change (2015 – 2020) |
| Economy | |
| Labor force (2017) | 14.94 million (39th) |
| Labor force by occupation (2012) | |
| Agriculture | 11% |
| Industry | 36% |
| Services | 53% |
| Unemployment rate (2017) | 3.4% (41st) |
| GDP (PPP) (estimate 2020) | |
| Total | $1.148 trillion (25th) |
| Per capita | $34,567 (45th) |
| GDP (nominal) (estimate 2020) | |
| Total | $381.523 billion (33rd) |
| Per capita | $11,484 (62nd) |
| GDP by sector (estimate 2017) | |
| Agriculture | 8.8% |
| Industry | 37.6% |
| Services | 53.6% |
| Exports (2017) | $187.9 billion (28th) |
| Exports partners (2017) | |
| Singapore | 15.1% |
| China | 12.6% |
| US | 9.4% |
| Japan | 8.2% |
| Thailand | 5.7% |
| Hong Kong | 4.5% |
| Imports (2017) | $160.7 billion (27th) |
| Imports partners (2017) | |
| China | 19.9% |
| Singapore | 10.8% |
| US | 8.4% |
| Japan | 7.6% |
| Thailand | 5.8% |
| South Korea | 4.5% |
| Indonesia | 4.4% |
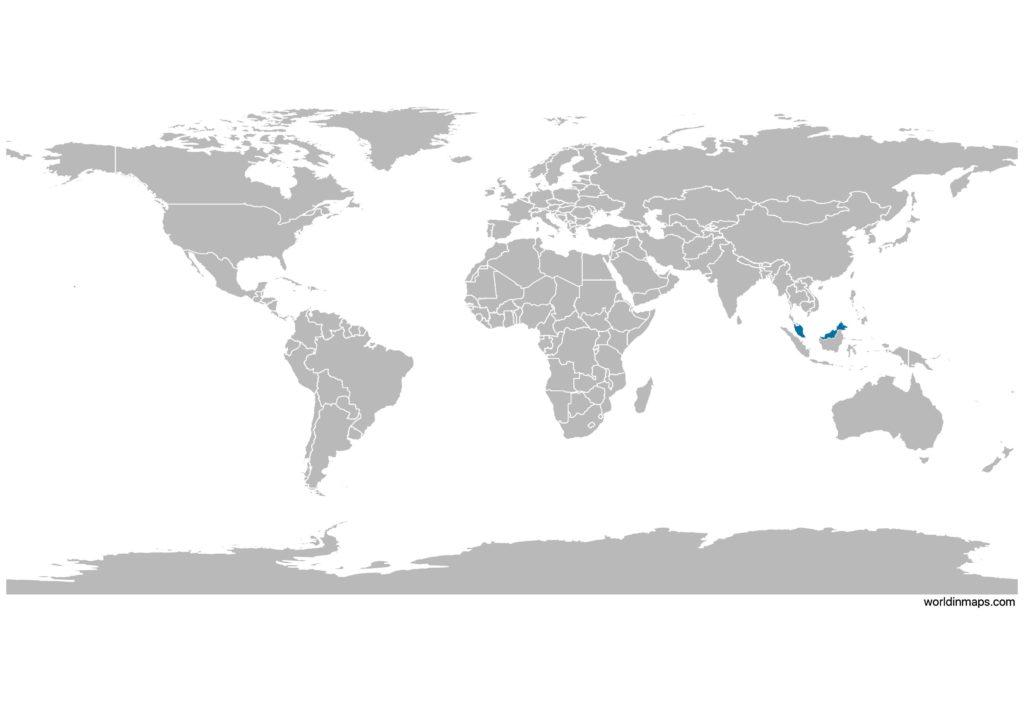
Malaysia on the world map
Malaysia top 10 largest cities (2010)
- Kuala Lumpur (1,588,750)
- Seberang Perai (818,197)
- George Town (708,127)
- Ipoh (657,892)
- Petaling Jaya (613,977)
- Shah Alam (541,306)
- Iskandar Puteri (529,074)
- Seremban (515,490)
- Johor Bahru (497,067)
- Malacca (484,885)
Demography
Population pyramid
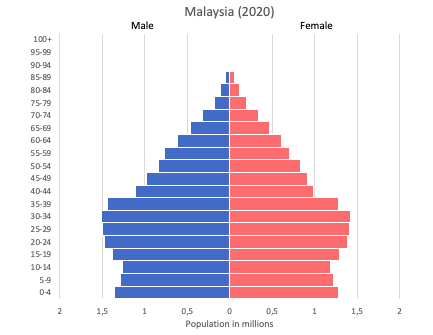
Age structure data
Estimate for 2020:
- 0-14 years: 26.8% (male 4,504,562/female 4,246,681)
- 15-24 years: 16.63% (male 2,760,244/female 2,670,186)
- 25-54 years: 40.86% (male 6,737,826/female 6,604,776)
- 55-64 years: 8.81% (male 1,458,038/female 1,418,280)65 years and over: 6.9% (male 1,066,627/female 1,184,863)
- 65 years and over: 6.9% (male 1,066,627/female 1,184,863)
Remark: the age structure of a population affects a nation’s key socioeconomic issues. Countries with young populations (high percentage under age 15) need to invest more in schools, while countries with older populations (high percentage ages 65 and over) need to invest more in the health sector. The age structure can also be used to help predict potential political issues. For example, the rapid growth of a young adult population unable to find employment can lead to unrest.
Population from 1950 to 2020
Source: United Nations, Department of Economic and Social Affairs, Population Division (2019). World Population Prospects 2019, Online Edition. Rev. 1.
Evolution of the life expectancy from 1960 to 2018
Source: World Development Indicators, The World Bank
Economy
Agriculture:
Peninsular Malaysia – palm oil, rubber, cocoa, rice
Sabah – palm oil, subsistence crops, rubber, timber
Sarawak – palm oil, rubber, timber, pepper
Industries:
Peninsular Malaysia – rubber and oil palm processing and manufacturing, petroleum and natural gas, light manufacturing, pharmaceuticals, medical technology, electronics and semiconductors, timber processing
Sabah – logging, petroleum and natural gas production
Sarawak – agriculture processing, petroleum and natural gas production, logging
Exports – commodities:
semiconductors and electronic equipment, palm oil, petroleum and liquefied natural gas, wood and wood products, palm oil, rubber, textiles, chemicals, solar panels
Imports – commodities:
electronics, machinery, petroleum products, plastics, vehicles, iron and steel products, chemicals
Time zone and current time in Malaysia
Go to our interactive map to get the current time in Malaysia