Chile
| Government | |
| Name | Republic of Chile |
| Spanish | República de Chile |
| Government type | Presidential republic |
| Capital | Santiago (5,428,590 (2002)) |
| Currency | Peso (CLP) |
| People | |
| Population (2020) | 19,116,209 (64th) |
| Density of population | 24 P/km2 (198th) |
| Nationality | Chilean |
| Official languages | |
| Spanish | |
| Ethnic groups (2012) | |
| Non-indigenous Chileans | 89% |
| Mapuche | 9.1% |
| Aymara | 0.7% |
| Other indigenous groups | 1.0% |
| Unspecified | 0.3% |
| Religions (2012) | |
| Roman Catholic | 66.7% |
| Evangelical or Protestant | 16.4% |
| Jehovah’s Witness | 1% |
| Other | 3.4% |
| None | 11.5% |
| Unspecified | 1.1% |
| Life expectancy (2020) | |
| Male | 76.3 years |
| Female | 82.5 years |
| Total population | 79.4 years (53rd) |
| Homicides | |
| Total (2018) | 4.4 per 100,000 people (69th) |
| Geography | |
| Land area | 743,812 km2 |
| water area | 12,290 km2 |
| total area | 756,102 km2 (39th) |
| Mean elevation | 1,871 m |
| Lowest point | |
| Pacific Ocean | 0 m |
| Highest point | |
| Nevado Ojos del Salado | 6,880 m |
| Land use (2011) | |
| Agricultural land | 21.1% |
| Arable land | 1.7% |
| Permanent crops | 0.6% |
| Permanent pasture | 18.8% |
| Forest | 21.9% |
| Other | 57% |
| Urbanization | |
| Urban population (2020) | 87.7% |
| Rate of urbanization | 0.87% annual rate of change (2015 – 2020) |
| Economy | |
| Labor force (2017) | 8.881 million (58th) |
| Labor force by occupation (2013) | |
| Agriculture | 9.2% |
| Industry | 23.7% |
| Services | 67.1% |
| Unemployment rate (2017) | 6.7% (99th) |
| GDP (PPP) (estimate 2020) | |
| Total | $528.300 billion (42nd) |
| Per capita | $27,150(57th) |
| GDP (nominal) (estimate 2020) | |
| Total | $308.505 billion (41st) |
| Per capita | $15,854 (53rd) |
| GDP by sector (estimate 2017) | |
| Agriculture | 4.2% |
| Industry | 32.8% |
| Services | 63% |
| Exports (2017) | $69.23 billion (42nd) |
| Exports partners (2017) | |
| China | 27.5% |
| US | 14.5% |
| Japan | 9.3% |
| South Korea | 6.2% |
| Brazil | 5% |
| Imports (2017) | $61.31 billion (49th) |
| Imports partners (2017) | |
| China | 23.9% |
| US | 18.1% |
| Brazil | 8.6% |
| Argentina | 4.5% |
| Germany | 4% |
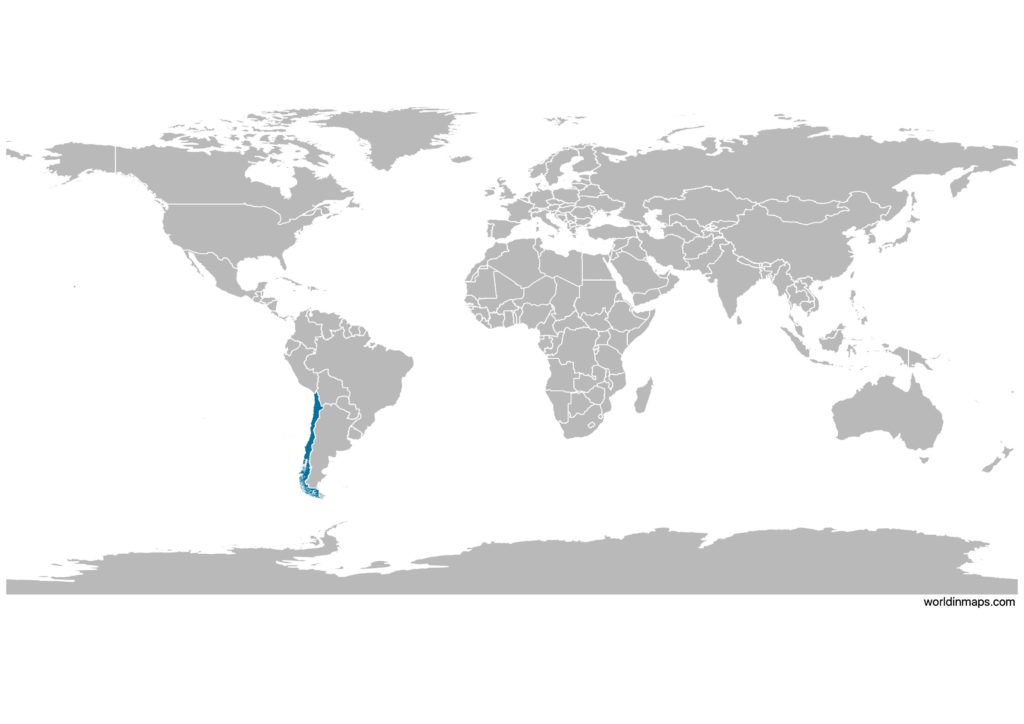
Chile on the world map
Chile top 10 largest cities (2002)
- Santiago (5,428,590)
- Greater Valparaíso (803,683)
- Greater Concepción (666,381)
- Greater La Serena (296,253)
- Antofagasta (285,255)
- Greater Temuco (260,878)
- Rancagua conurbation (236,363)
- Talca (191,154)
- Arica (175,441)
- Chillán conurbation (165,528)
Demography
Population pyramid
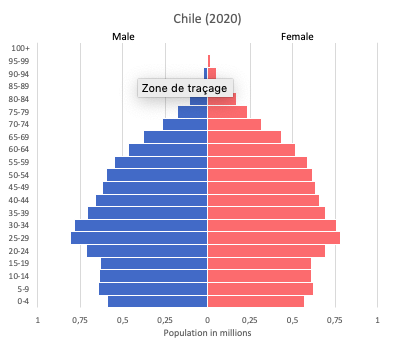
Age structure data
Estimate for 2020:
- 0-14 years: 19.79% (male 1,836,240/female 1,763,124)
- 15-24 years: 13.84% (male 1,283,710/female 1,233,238)
- 25-54 years: 42.58% (male 3,882,405/female 3,860,700)
- 55-64 years: 11.98% (male 1,034,049/female 1,145,022)
- 65 years and over: 11.81% (male 902,392/female 1,245,890)
Remark: the age structure of a population affects a nation’s key socioeconomic issues. Countries with young populations (high percentage under age 15) need to invest more in schools, while countries with older populations (high percentage ages 65 and over) need to invest more in the health sector. The age structure can also be used to help predict potential political issues. For example, the rapid growth of a young adult population unable to find employment can lead to unrest.
Population from 1950 to 2020
Source: United Nations, Department of Economic and Social Affairs, Population Division (2019). World Population Prospects 2019, Online Edition. Rev. 1.
Evolution of the life expectancy from 1960 to 2018
Source: World Development Indicators, The World Bank
Economy
Agriculture:
grapes, apples, pears, onions, wheat, corn, oats, peaches, garlic, asparagus, beans, beef, poultry, wool, fish, timber
Industries:
copper, lithium, other minerals, foodstuffs, fish processing, iron and steel, wood and wood products, transport equipment, cement, textiles
Exports – commodities:
copper, fruit, fish products, paper and pulp, chemicals, wine
Imports – commodities:
petroleum and petroleum products, chemicals, electrical and telecommunications equipment, industrial machinery, vehicles, natural gas
Time zone and current time in Chile
Go to our interactive map to get the current time in Chile