Austria
| Government | |
| Name | Republic of Austria |
| German | Republik Österreich |
| Government type | Federal parliamentary republic |
| Capital | Vienne (1,812,605 (2014)) |
| Currency | Euro (EUR) |
| People | |
| Population (2020) | 9,006,400 (98th) |
| Density of population | 106 P/km2 (106th) |
| Nationality | Austrian |
| Official languages | |
| German | official nationwide |
| Croatian | official in Burgenland |
| Slovene | official in southern Carinthia |
| Hungarian | Official in Burgenland |
| Ethnic groups (2018) | |
| Austrian | 80.8% |
| German | 2.6% |
| Bosnian and Herzegovinian | 1.9% |
| Turkish | 1.8% |
| Serbian | 1.6% |
| Romanian | 1.3% |
| Other | 10% |
| Religion (2018) | |
| Catholic | 57% |
| Eastern Orthodox | 8.7% |
| Muslim (estimate 2016) | 7.9% |
| Evangelical Christian | 3.3% |
| Other / none / unspecified | 23.1% |
| Life expectancy (2020) | |
| Male | 79.2 years |
| Female | 84.7 years |
| Total population | 81.9 years (25th) |
| Homicides | |
| Total (2018) | 1.0 per 100,000 people (142nd) |
| Geography | |
| Land area | 82,445km2 |
| water area | 1,426 km2 |
| total area | 83,871 km2 (115th) |
| Mean elevation | 910 m |
| Lowest point | |
| Neusiedler | 115 m |
| Highest point | |
| Grossglockner | 3,798 m |
| Land use (2016) | |
| Agricultural land | 38.4% |
| Arable land | 16.5% |
| Permanent crops | 0.8% |
| Permanent pasture | 21.1% |
| Forest | 47.2% |
| Other | 14.4% |
| Urbanization | |
| Urban population (2020) | 58.7% |
| Rate of urbanization | 0.59% annual rate of change (2015 – 2020) |
| Economy | |
| Labor force (2017) | 4.26 million (90th) |
| Agriculture | 0.7% |
| Industry | 25.2% |
| Services | 74.1% |
| Unemployment rate (2017) | 5.5% (80rd) |
| GDP (PPP) (estimate 2018) | |
| Total | $461.432 billion |
| Per capita | $51,936 (17th) |
| GDP (nominal) (estimate 2018) | |
| Total | $477.672 billion (29th) |
| Per capita | $53,764 (13th) |
| GDP by sector (estimate 2017) | |
| Agriculture | 1.3% |
| Industry | 28.4% |
| Services | 70.3% |
| Exports (2017) | $156.7 billion (32nd) |
| Exports partners (2017) | |
| Germany | 29.4% |
| US | 6.3% |
| Italy | 6.2% |
| Switzerland | 5.1% |
| France | 4.8% |
| Slovakia | 4.8 |
| Imports (2017) | $158.1 billion (28th) |
| Imports partners (2017) | |
| Germany | 41.8% |
| Italy | 5.8% |
| Switzerland | 5.5% |
| Czech Republic | 4.4% |
| Netherlands | 4.2% |
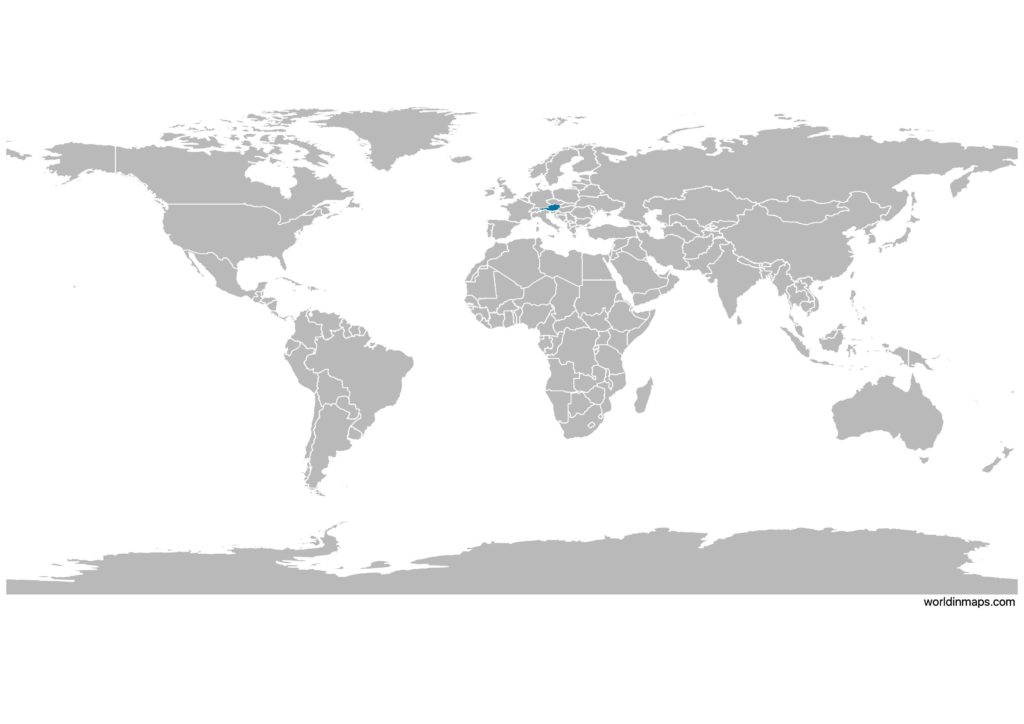
Austria on the world map
Austria top 10 largest cities (2014)
- Vienne (1,812,605)
- Graz (269,997)
- Linz (193,814)
- Salzburg (146,631)
- Innsbruck (124,579)
- Klagenfurt (96,640)
- Villach (60,004)
- Wels (59,339)
- Sankt Pölten (52,145)
- Dornbirn (46,883)
Demography
Population pyramid
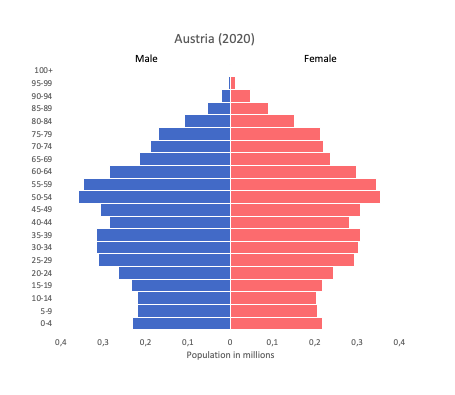
Age structure data
Estimate for 2020:
- 0-14 years: 14.01% (male 635,803/female 605,065)
- 15-24 years: 10.36% (male 466,921/female 451,248)
- 25-54 years: 41.35% (male 1,831,704/female 1,831,669)
- 55-64 years: 14.41% (male 635,342/female 641,389)
- 65 years and over: 19.87% (male 768,687/female 991,621)
Remark: the age structure of a population affects a nation’s key socioeconomic issues. Countries with young populations (high percentage under age 15) need to invest more in schools, while countries with older populations (high percentage ages 65 and over) need to invest more in the health sector. The age structure can also be used to help predict potential political issues. For example, the rapid growth of a young adult population unable to find employment can lead to unrest.
Population from 1950 to 2020
Source: United Nations, Department of Economic and Social Affairs, Population Division (2019). World Population Prospects 2019, Online Edition. Rev. 1.
Evolution of the life expectancy from 1960 to 2018
Source: World Development Indicators, The World Bank
Economy
Agriculture:
grains, potatoes, wine, fruit, dairy products, cattle, pigs, poultry, lumber and other forestry products
Industries:
construction, machinery, vehicles and parts, food, metals, chemicals, lumber and paper, electronics, tourism
Exports – commodities:
machinery and equipment, motor vehicles and parts, manufactured goods, chemicals, iron and steel, foodstuffs
Imports – commodities:
machinery and equipment, motor vehicles, chemicals, metal goods, oil and oil products, natural gas, foodstuffs
Time zone and current time in Austria
Go to our interactive map to get the current time in Austria