Switzerland

| Government | |
| Name | Swiss Confederation |
| German | Schweizerische Eidgenossenschaft |
| French | Confédération Suisse |
| Italian | Confederazione Svizzera |
| Romansh | Confederaziun svizra |
| Government type | federal republic (formally a confederation) |
| Capital | Bern (133,883 (2018)) |
| Currency | Swiss franc (CHF) |
| People | |
| Population (2020) | 8,654,618 (99th) |
| Density of population | 207 P/km2 (48th) |
| Nationality | Swiss |
| Official languages | |
| German (or Swiss German) | |
| French | |
| Italian | |
| Romansh | |
| Ethnic groups (2018) | |
| Swiss | 69.5% |
| German | 4.2% |
| Italian | 3.2% |
| Portuguese | 2.6% |
| French | 2% |
| Kosovar | 1.1% |
| Other | 17.3% |
| unspecified | 0.1% |
| note: data represent permanent and non-permanent resident population by country of birth | |
| Religions (2017) | |
| Roman Catholic | 35.9% |
| Protestant | 23.8% |
| other Christian | 5.9% |
| Muslim | 5.4% |
| Jewish | 0.3% |
| other | 1.4% |
| None | 26% |
| unspecified | 1.4% |
| Life expectancy (2020) | |
| Male | 80.5 years |
| Female | 85.3 years |
| Total population | 82.8 years (13th) |
| Homicides | |
| Total (2018) | 0.6 per 100,000 people (156th) |
| Geography | |
| Land area | 39,997 km2 |
| water area | 1,280 km2 |
| total area | 41,277 km2 (136th) |
| Mean elevation | 1,350 m |
| Lowest point | |
| Lake Maggiore | 195 m |
| Highest point | |
| Dufourspitze | 4,634 m |
| Land use (2011) | |
| Agricultural land | 38.7% |
| Arable land | 10.2% |
| Permanent crops | 0.6% |
| Permanent pasture | 27.9% |
| Forest | 31.5% |
| Other | 29.8% |
| Urbanization | |
| Urban population (2020) | 73.9% |
| Rate of urbanization | 0.88% annual rate of change (2015 – 2020) |
| Economy | |
| Labor force (2017) | 5.159 million (81st) |
| Labor force by occupation (2015) | |
| Agriculture | 3.3% |
| Industry | 19.8% |
| Services | 76.9% |
| Unemployment rate (2017) | 3.2% (40th) |
| GDP (PPP) (estimate 2020) | |
| Total | $548 billion (38th) |
| Per capita | $67,558 (9th) |
| GDP (nominal) (estimate 2018) | |
| Total | $704 billion (20th) |
| Per capita | $82,950 (2nd) |
| GDP by sector (estimate 2017) | |
| Agriculture | 0.7% |
| Industry | 25.6% |
| Services | 73.7% |
| Exports (2017) | $313.5 billion (17th) |
| Exports partners (2017) | |
| Germany | 15.2% |
| US | 12.3% |
| China | 8.2% |
| India | 6.7% |
| France | 5.7% |
| UK | 5.7% |
| Hong Kong | 5.4% |
| Italy | 5.3% |
| Imports (2017) | $264.5 billion (18th) |
| Imports partners (2017) | |
| Germany | 20.9% |
| US | 7.9% |
| Italy | 7.6% |
| UK | 7.3% |
| France | 6.8% |
| China | 5% |
Switzerland on the world map
Switzerland top 10 largest cities (2018)
- Zürich (415,367)
- Geneva (201,818)
- Basel (177,654)
- Lausanne (139,111)
- Bern (133,883)
- Winterthur (111,851)
- Lucerne (81,691)
- St. Gallen (75,833)
- Lugano (63,185)
- Biel / Bienne (55,159)
Demography
Population pyramid
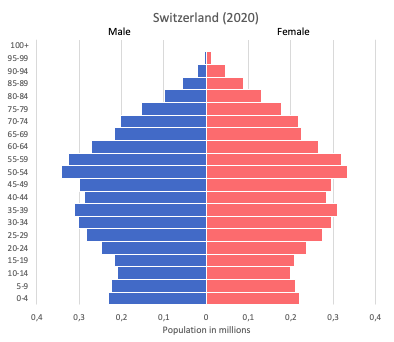
Age structure data
Estimate for 2020:
- 0-14 years: 15.34% (male 664,255/female 625,252)
- 15-24 years: 10.39% (male 446,196/female 426,70
- 25-54 years: 42.05% (male 1,768,245/female 1,765,941)
- 55-64 years: 13.48% (male 569,717/female 563,482)
- 65 years and over: 18.73% (male 699,750/female 874,448)
Remark: the age structure of a population affects a nation’s key socioeconomic issues. Countries with young populations (high percentage under age 15) need to invest more in schools, while countries with older populations (high percentage ages 65 and over) need to invest more in the health sector. The age structure can also be used to help predict potential political issues. For example, the rapid growth of a young adult population unable to find employment can lead to unrest.
Population from 1950 to 2020
Source: United Nations, Department of Economic and Social Affairs, Population Division (2019). World Population Prospects 2019, Online Edition. Rev. 1.
Evolution of the life expectancy from 1960 to 2018
Source: World Development Indicators, The World Bank
Economy
Agriculture:
grains, fruits, vegetables, meat, eggs, dairy products
Industries:
machinery, chemicals, watches, textiles, precision instruments, tourism, banking, insurance, pharmaceuticals
Exports – commodities:
machinery, chemicals, metals, watches, agricultural products
Imports – commodities:
machinery, chemicals, vehicles, metals, agricultural products, textiles
Time zone and current time in Switzerland
Go to our interactive map to get the current time in Switzerland