Bulgaria
| Government | |
| Name | Republic of Bulgaria |
| Bulgarian | Република България Republika Balgariya |
| Government type | Parliamentary republic |
| Capital | Sofia ( 1,204,685 (2011)) |
| Currency | Lev (BGN) |
| People | |
| Population (2020) | 6,948.445 (107th) |
| Density of population | 63 P/km2 (118th) |
| Nationality | Bulgarian |
| Official languages | |
| Bulgarian | |
| Ethnic groups (2011) | |
| Bulgarian | 76.9% |
| Turkish | 8% |
| Romani (usually underestimated in official statistics and may represent 9-11% | 4.4% |
| Other | 0.7% |
| Religions (2011) | |
| Eastern Orthodox | 59.4% |
| Muslim | 7.8% |
| Other | 1.7% |
| None | 3.7% |
| Unspecified | 27.4% |
| Life expectancy (2020) | |
| Male | 71.8 years |
| Female | 78.5 years |
| Total population | 75 years (121st) |
| Homicides | |
| Total (2018) | 1.3 per 100,000 people (124th) |
| Geography | |
| Land area | 108,489 km2 |
| water area | 2,390 km2 |
| total area | 110,879 km2 (106th) |
| Mean elevation | 472 m |
| Lowest point | |
| Black Sea | 0 m |
| Highest point | |
| Musala | 2,925 m |
| Land use (2011) | |
| Agricultural land | 46.9% |
| Arable land | 29.9% |
| Permanent crops | 1.5% |
| Permanent pasture | 15.5% |
| Forest | 36.7% |
| Other | 16.4% |
| Urbanization | |
| Urban population (2020) | 75.7% |
| Rate of urbanization | 0.22% annual rate of change (2015 – 2020) |
| Economy | |
| Labor force (2017) | 3.357 million (102nd) |
| Labor force by occupation (2013) | |
| Agriculture | 6.8% |
| Industry | 26.6% |
| Services | 66.6% |
| Unemployment rate (2017) | 6.2% (93rd) |
| GDP (PPP) (estimate 2020) | |
| Total | $180.170 billion (74th) |
| Per capita | $26,034(60th) |
| GDP (nominal) (estimate 2020) | |
| Total | $70.126 billion (72nd) |
| Per capita | $10,133 (68th) |
| GDP by sector (estimate 2017) | |
| Agriculture | 4.3% |
| Industry | 28% |
| Services | 67.4% |
| Exports (2017) | $29.08 billion (65th) |
| Exports partners (2017) | |
| Germany | 13.5% |
| Italy | 8.3% |
| Romania | 8.2% |
| Turkey | 7.7% |
| Greece | 6.5% |
| Belgium | 4.2% |
| France | 4.1% |
| Imports (2017) | $31.43 billion (66th) |
| Imports partners (2017) | |
| Germany | 12.3% |
| Russia | 10.3% |
| Italy | 7.3% |
| Romania | 7.1% |
| Turkey | 6.2% |
| Spain | 5.3% |
| Greece | 4.4% |
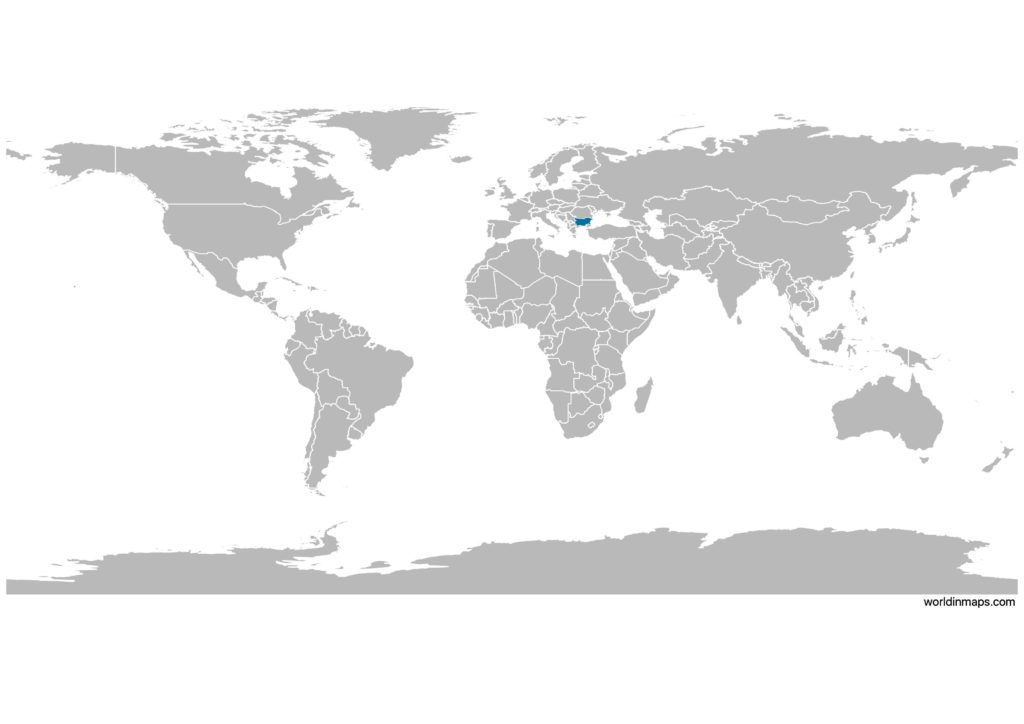
Bulgaria on the world map
Bulgaria top 10 largest cities (2011)
- Sofia (1,204,685)
- Plovdiv (338,153)
- Varna (334,870)
- Burgas (200,271)
- Ruse (148,642)
- Stara Zagora (138,272)
- Pleven (106,954)
- Sliven (91,620)
- Dobrich (91,030)
- Shumen (80,855)
Demography
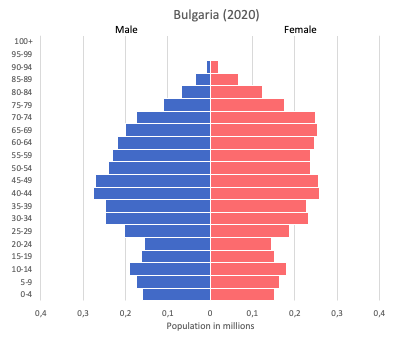
Population pyramid
Age structure data
Estimate for 2020:
- 0-14 years: 14.52% (male 520,190/female 491,506)
- 15-24 years: 9.4% (male 340,306/female 314,241)
- 25-54 years: 42.87% (male 1,538,593/female 1,448,080)
- 55-64 years: 13.15% (male 433,943/female 482,474)
- 65 years and over: 20.06% (male 562,513/female 835,053)
Remark: the age structure of a population affects a nation’s key socioeconomic issues. Countries with young populations (high percentage under age 15) need to invest more in schools, while countries with older populations (high percentage ages 65 and over) need to invest more in the health sector. The age structure can also be used to help predict potential political issues. For example, the rapid growth of a young adult population unable to find employment can lead to unrest.
Population from 1950 to 2020
Source: United Nations, Department of Economic and Social Affairs, Population Division (2019). World Population Prospects 2019, Online Edition. Rev. 1.
Evolution of the life expectancy from 1960 to 2018
Source: World Development Indicators, The World Bank
Economy
Agriculture:
vegetables, fruits, tobacco, wine, wheat, barley, sunflowers, sugar beets, livestock
Industries:
electricity, gas, water; food, beverages, tobacco, machinery and equipment, automotive parts, base metals, chemical products, coke, refined petroleum, nuclear fuel, outsourcing centers
Exports – commodities:
clothing, footwear, iron and steel, machinery and equipment, fuels, agriculture, tobacco, IT components
Imports – commodities:
machinery and equipment; metals and ores, chemicals and plastics; fuels, minerals, and raw materials
Time zone and current time in Bulgaria
Go to our interactive map to get the current time in Bulgaria