Belgium
| Government | |
| Name | Kingdom of Belgium |
| Dutch | Koninkrijk België |
| French | Royaume de Belgique |
| German | Königreich Belgien |
| Government type | Federal parliamentary democracy under a constitutional monarchy |
| Capital | Brussels (Brussels-Capital Region: 1,212,352 (2020)) |
| Currency | Euro (EUR) |
| People | |
| Population (2020) | 11,589,616 (81st) |
| Density of population | 376 P/km2 (22nd) |
| Nationality | Belgian |
| Official languages | |
| Dutch | 60% |
| French | 40% |
| German | < 1% |
| Ethnic groups (2012) | |
| Belgian | 75.2% |
| Italian | 4.1% |
| Moroccan | 3.7% |
| French | 2.4% |
| Turkish | 2% |
| Dutch | 2% |
| Other | 10.6% |
| Religions (2009) | |
| Roman Catholic | 50% |
| Protestant and other Christian | 2.5% |
| Muslim | 5% |
| Jewish | 0.4% |
| Buddhist | 0.3% |
| Atheist | 9.2% |
| None | 32.6% |
| Life expectancy (2020) | |
| Male | 78.8 years |
| Female | 84.2 years |
| Total population | 81.4 years (31st) |
| Homicides | |
| Total (2017) | 1.7 per 100,000 people (114th) |
| Geography | |
| Land area | 30,278 km2 |
| water area | 250 km2 |
| total area | 30,528 km2 (141st) |
| Mean elevation | 181 m |
| Lowest point | |
| North Sea | 0 m |
| Highest point | |
| Botrange | 694 m |
| Land use (2011) | |
| Agricultural land | 44.1% |
| Arable land | 27.2% |
| Permanent crops | 0.8% |
| Permanent pasture | 16.1% |
| Forest | 22.4% |
| Other | 33.5% |
| Urbanization | |
| Urban population (2020) | 98.1% |
| Rate of urbanization | 0.62% annual rate of change (2015 – 2020) |
| Economy | |
| Labor force (2017) | 5.324 million (79th) |
| Labor force by occupation (2013) | |
| Agriculture | 1.3% |
| Industry | 18.6% |
| Services | 80.1% |
| Unemployment rate (2017) | 7.1% (108th) |
| GDP (PPP) (estimate 2018) | |
| Total | $550 billion (38th) |
| Per capita | $48,224(20th) |
| GDP (nominal) (estimate 2018) | |
| Total | $533 billion (23rd) |
| Per capita | $46,724 (17th) |
| GDP by sector (estimate 2017) | |
| Agriculture | 0.7% |
| Industry | 22.1% |
| Services | 77.2% |
| Exports (2017) | $300.8 billion (20th) |
| Exports partners (2017) | |
| Germany | 16.6% |
| France | 14.9% |
| Netherlands | 12% |
| UK | 8.4% |
| Italy | 4.9% |
| US | 4.8% |
| Imports (2017) | $300.4 billion (17th) |
| Imports partners (2017) | |
| Netherlands | 17.3% |
| Germany | 13.8% |
| France | 9.5% |
| US | 7.1% |
| UK | 4.9% |
| Ireland | 4.2% |
| China | 4.1% |
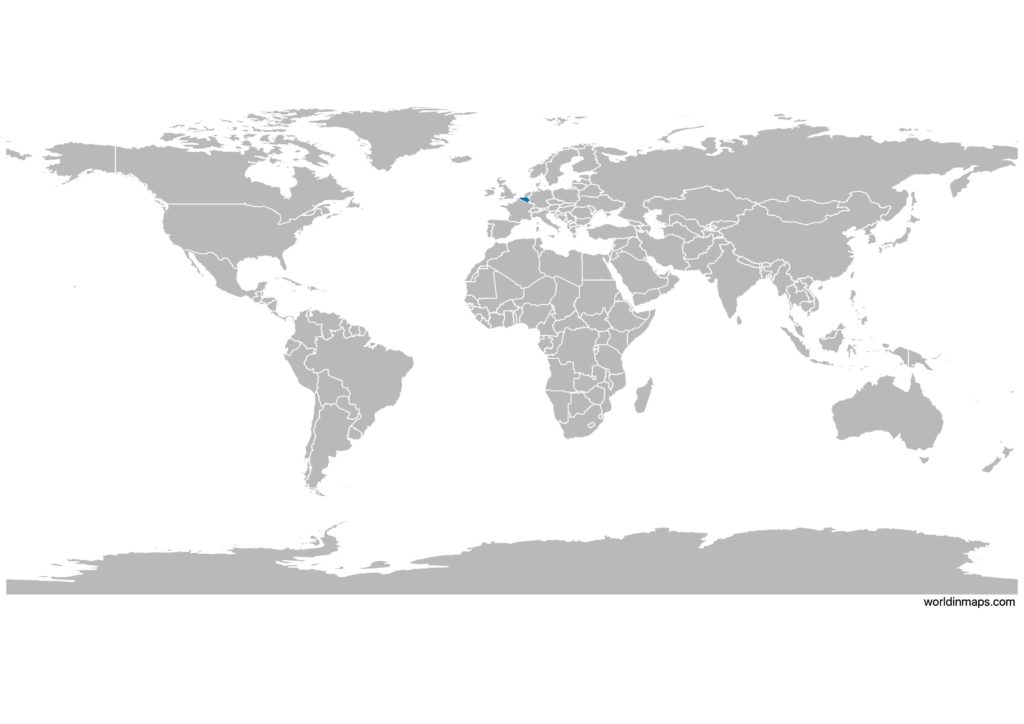
Belgium on the world map
Belgium top 10 largest cities (2018)
- Antwerp (523,248)
- Ghent (260,341)
- Charleroi (201,816)
- Liège (197,355)
- City of Brussels – Part of Brussels-Capital Region (179,277)
- Schaerbeek – Part of Brussels-Capital Region (133,010)
- Anderlecht – Part of Brussels-Capital Region (118,382)
- Bruges (118,284)
- Namur (110,939)
- Leuven (101,396)
Demography
Population pyramid
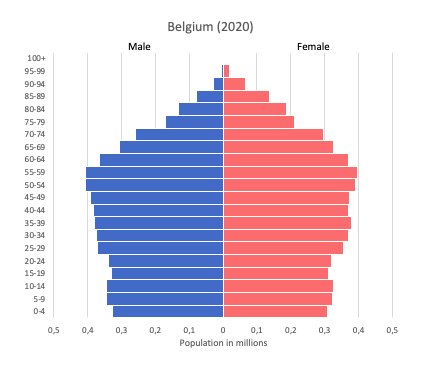
Age structure data
Estimate for 2020:
- 0-14 years: 17.22% (male 1,033,383/female 984,624)
- 15-24 years: 11.2% (male 670,724/female 642,145)
- 25-54 years: 39.23% (male 2,319,777/female 2,278,450)
- 55-64 years: 13.14% (male 764,902/female 775,454)
- 65 years and over: 19.21% (male 988,148/female 1,263,109)
Remark: the age structure of a population affects a nation’s key socioeconomic issues. Countries with young populations (high percentage under age 15) need to invest more in schools, while countries with older populations (high percentage ages 65 and over) need to invest more in the health sector. The age structure can also be used to help predict potential political issues. For example, the rapid growth of a young adult population unable to find employment can lead to unrest.
Population from 1950 to 2020
Source: United Nations, Department of Economic and Social Affairs, Population Division (2019). World Population Prospects 2019, Online Edition. Rev. 1.
Evolution of the life expectancy from 1960 to 2018
Source: World Development Indicators, The World Bank
Economy
Agriculture:
sugar beets, fresh vegetables, fruits, grain, tobacco, beef, veal, pork, milk
Industries:
engineering and metal products, motor vehicle assembly, transportation equipment, scientific instruments, processed food and beverages, chemicals, pharmaceuticals, base metals, textiles, glass, petroleum
Exports – commodities:
chemicals, machinery and equipment, finished diamonds, metals and metal products, foodstuffs
Imports – commodities:
raw materials, machinery and equipment, chemicals, raw diamonds, pharmaceuticals, foodstuffs, transportation equipment, oil products
Time zone and current time in Belgium
Go to our interactive map to get the current time in Belgium