Greece

| Government | |
| Name | Hellenic Republic |
| Greek | Ελληνική Δημοκρατία Ellinikí Dimokratía |
| Government type | Parliamentary republic |
| Capital | Athens (3,090,508 (2011)) |
| Currency | Euro (EUR) |
| People | |
| Population (2020) | 10,423,056 (85th) |
| Density of population | 82 P/km2 (125th) |
| Nationality | Greek |
| Official languages | |
| Greek | |
| Ethnic groups (2011) | |
| Greek | 91.6% |
| Albanian | 4.4% |
| Other | 4% |
| Note: the data represent citizenship (no data are available for ethnicity) | |
| Religions (2015) | |
| Greek Orthodox (official) | 81-90% |
| Muslim | 2% |
| Other | 3% |
| None | 4-15% |
| Unspecified | 1% |
| Life expectancy (2020) | |
| Male | 78.5 years |
| Female | 83.8 years |
| Total population | 81.1 years (38th) |
| Homicides | |
| Total (2018) | 0.9 per 100,000 people (144th) |
| Geography | |
| Land area | 130,647 km2 |
| water area | 1,310 km2 |
| total area | 131,957 km2 (98th) |
| Mean elevation | 498 m |
| Lowest point | |
| Mediterranean Sea | 0 m |
| Highest point | |
| Mount Olympus | 2,917 m |
| Land use (2011) | |
| Agricultural land | 63.4% |
| Arable land | 19.7% |
| Permanent crops | 8.9% |
| Permanent pasture | 34.8% |
| Forest | 30.5% |
| Other | 6.1% |
| Urbanization | |
| Urban population (2020) | 79.7% |
| Rate of urbanization | 0.22% annual rate of change (2015 – 2020) |
| Economy | |
| Labor force (2017) | 4.769 million (84th) |
| Labor force by occupation (2015) | |
| Agriculture | 12.6% |
| Industry | 15% |
| Services | 72.4% |
| Unemployment rate (2017) | 21.5% (189th) |
| GDP (PPP) (estimate 2020) | |
| Total | $337.900 billion (55th) |
| Per capita | $31,616(50th) |
| GDP (nominal) (estimate 2020) | |
| Total | $222.785 billion (50th) |
| Per capita | $20,845 (39th) |
| GDP by sector (estimate 2017) | |
| Agriculture | 4.1% |
| Industry | 16.9% |
| Services | 79.1% |
| Exports (2017) | $31.54 billion (63rd) |
| Exports partners (2017) | |
| Italy | 10.6% |
| Germany | 7.1% |
| Turkey | 6.8% |
| Cyprus | 6.5% |
| Bulgaria | 4.9% |
| Lebanon | 4.3% |
| Imports (2017) | $52.27 billion (52nd) |
| Imports partners (2017) | |
| Germany | 10.4% |
| Italy | 8.2% |
| Russia | 6.8% |
| Iraq | 6.3% |
| South Korea | 6.1% |
| China | 5.4% |
| Netherlands | 5.3% |
| France | 4.3% |
Greece on the world map
Greece top 10 largest cities (2011)
- Athens (3,090,508)
- Thessaloniki (824,676)
- Patras (167,446)
- Larissa (144,651)
- Heraklion (140,730)
- Volos (86,046)
- Ioannina (65,574)
- Trikala (61,653)
- Chalcis (59,125)
- Serres (58,287)
Demography
Population pyramid
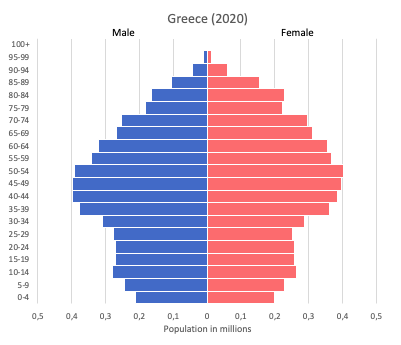
Age structure data
Estimate for 2020:
- 0-14 years: 14.53% (male 794,918/female 745,909)
- 15-24 years: 10.34% (male 577,134/female 519,819)
- 25-54 years: 39.6% (male 2,080,443/female 2,119,995)
- 55-64 years: 13.1% (male 656,404/female 732,936)
- 65 years and over: 22.43% (male 1,057,317/female 1,322,176)
Remark: the age structure of a population affects a nation’s key socioeconomic issues. Countries with young populations (high percentage under age 15) need to invest more in schools, while countries with older populations (high percentage ages 65 and over) need to invest more in the health sector. The age structure can also be used to help predict potential political issues. For example, the rapid growth of a young adult population unable to find employment can lead to unrest.
Population from 1950 to 2020
Source: United Nations, Department of Economic and Social Affairs, Population Division (2019). World Population Prospects 2019, Online Edition. Rev. 1.
Evolution of the life expectancy from 1960 to 2018
Source: World Development Indicators, The World Bank
Economy
Agriculture:
wheat, corn, barley, sugar beets, olives, tomatoes, wine, tobacco, potatoes; beef, dairy products
Industries:
tourism, food and tobacco processing, textiles, chemicals, metal products; mining, petroleum
Exports – commodities:
food and beverages, manufactured goods, petroleum products, chemicals, textiles
Imports – commodities:
machinery, transport equipment, fuels, chemicals
Time zone and current time in Greece
Go to our interactive map to get the current time in Greece