Colombia

| Government | |
| Name | Republic of Colombia |
| Spanish | República de Colombia |
| Government type | Presidential republic |
| Capital | Bogotá (7,387,400 (2018)) |
| Currency | Peso (COP) |
| People | |
| Population (2020) | 50,882,884 (28th) |
| Density of population | 42.23 P/km2 (173th) |
| Nationality | Colombian |
| Official languages | |
| Spanish | |
| Ethnic groups (2018) | |
| Mestizo and white | 87.6% |
| Afro-Colombian (includes mulatto, Raizal, and Palenquero) | 6.8% |
| Amerindian | 4.3% |
| Unspecified | 1.4% |
| Religions (2014) | |
| Roman Catholic | 79% |
| Protestant | 14% |
| Pentecostal | 6% |
| Mainline Protestant | 2% |
| Other protestant | 6% |
| Other | 2% |
| Unspecified | 5% |
| Life expectancy (2020) | |
| Male | 73.5 years |
| Female | 80 years |
| Total population | 76.6 years (92nd) |
| Homicides | |
| Total (2018) | 25.3 per 100,000 people (16th) |
| Geography | |
| Land area | 1,038,700 km2 |
| water area | 100,210 km2 |
| total area | 1,138,910 km2 (27th) |
| Mean elevation | 593 m |
| Lowest point | |
| Pacific Ocean | 0 m |
| Highest point | |
| Pico Cristobal Colon | 5,730 m |
| Land use (2011) | |
| Agricultural land | 37.5% |
| Arable land | 1.4% |
| Permanent crops | 1.6% |
| Permanent pasture | 34.5% |
| Forest | 54.4% |
| Other | 8.1% |
| Urbanization | |
| Urban population (2020) | 81.4% |
| Rate of urbanization | 1.22% annual rate of change (2015 – 2020) |
| Economy | |
| Labor force (2017) | 25.76 million (25th) |
| Labor force by occupation (2011) | |
| Agriculture | 17% |
| Industry | 21% |
| Services | 62% |
| Unemployment rate (2017) | 9.3% (134th) |
| GDP (PPP) (estimate 2020) | |
| Total | $827.662 billion (31st) |
| Per capita | $16,264 |
| GDP (nominal) (estimate 2020) | |
| Total | $343.177 billion (38th) |
| Per capita | $6,744 |
| GDP by sector (estimate 2017) | |
| Agriculture | 7.2% |
| Industry | 30.8% |
| Services | 62.1% |
| Exports (2017) | $39.48 billion (55th) |
| Exports partners (2017) | |
| US | 28.5% |
| Panama | 8.6% |
| China | 5.1% |
| Imports (2017) | $44.24 billion (57th) |
| Imports partners (2017) | |
| US | 26.3% |
| China | 19.3% |
| Mexico | 7.5% |
| Brazil | 5% |
| Germany | 4.1% |
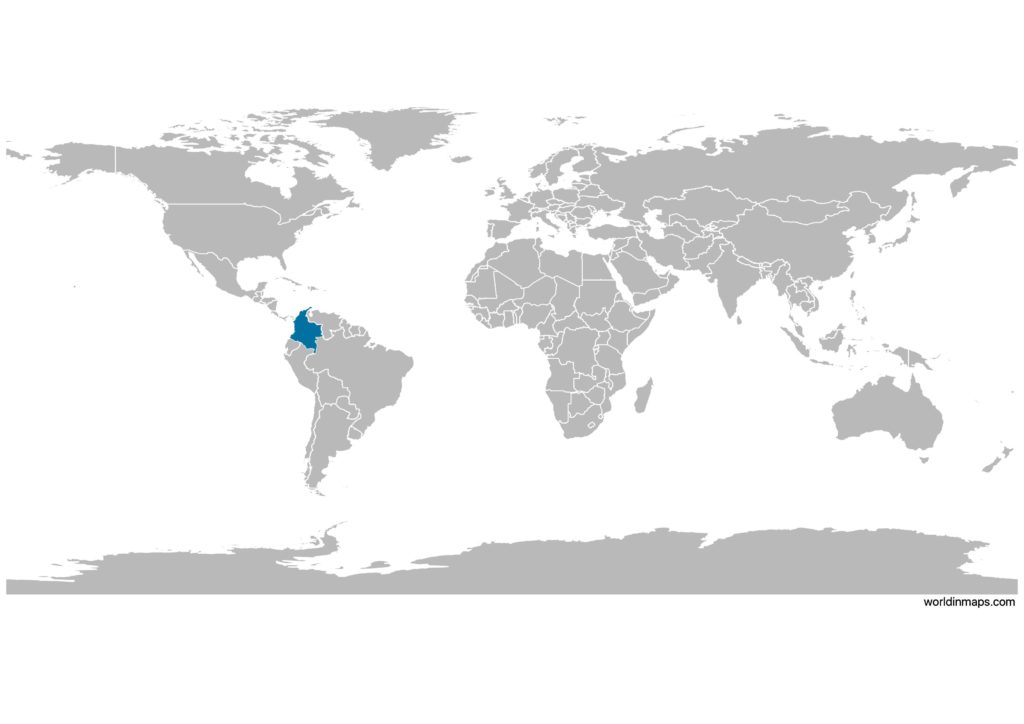
Colombia on the world map
Colombia top 10 largest cities (2018)
- Bogotá (7,387,400)
- Medellín (2,382,399)
- Cali (2,172,527)
- Barranquilla (1,205,284)
- Cartagena (876,885)
- Cúcuta (685,445)
- Soacha (655,025)
- Soledad (602,644)
- Bucaramanga (570,752)
- Bello (495,483)
Demography
Population pyramid
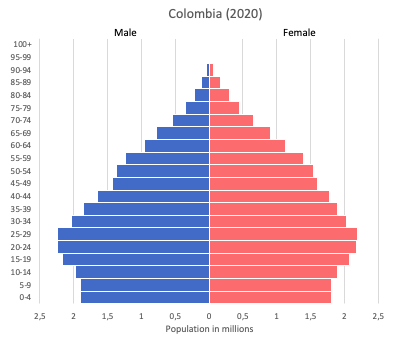
Age structure data
Estimate for 2020:
- 0-14 years: 23.27% (male 5,853,351/female 5,567,196)
- 15-24 years: 16.38% (male 4,098,421/female 3,939,870)
- 25-54 years: 42.04% (male 10,270,516/female 10,365,423)
- 55-64 years: 9.93% (male 2,307,705/female 2,566,173)
- 65 years and over: 8.39% (male 1,725,461/female 2,390,725)
Remark: the age structure of a population affects a nation’s key socioeconomic issues. Countries with young populations (high percentage under age 15) need to invest more in schools, while countries with older populations (high percentage ages 65 and over) need to invest more in the health sector. The age structure can also be used to help predict potential political issues. For example, the rapid growth of a young adult population unable to find employment can lead to unrest.
Population from 1950 to 2020
Source: United Nations, Department of Economic and Social Affairs, Population Division (2019). World Population Prospects 2019, Online Edition. Rev. 1.
Evolution of the life expectancy from 1960 to 2018
Source: World Development Indicators, The World Bank
Economy
Agriculture:
coffee, cut flowers, bananas, rice, tobacco, corn, sugarcane, cocoa beans, oilseed, vegetables, shrimp, forest products
Industries:
textiles, food processing, oil, clothing and footwear, beverages, chemicals, cement, gold, coal, emeralds
Exports – commodities:
petroleum, coal, emeralds, coffee, nickel, cut flowers, bananas, apparel
Imports – commodities:
industrial equipment, transportation equipment, consumer goods, chemicals, paper products, fuels, electricity
Time zone and current time in Colombia
Go to our interactive map to get the current time in Colombia