Eritrea
| Government | |
| Name | State of Eritrea |
| Government type | Presidential republic |
| Capital | Asmara (963,000) |
| Currency | Nakfa (ERN) |
| People | |
| Population (2020) | 3,546,427 |
| Density of population | 51.7 P/km2 |
| Nationality | Eritrean |
| Official languages | |
| Tigrinya | |
| Arabic | |
| English | |
| Ethnic groups (2010) | |
| Tigrinya | 55% |
| Tigre | 30% |
| Saho | 4% |
| Kunama | 2% |
| Rashaida | 2% |
| Bilen | 2% |
| other (Afar, Beni Amir, Nera) | 5% |
| note: data represent Eritrea’s nine recognized ethnic groups | |
| Religions | |
| Sunni Muslim | |
| Coptic Christian | |
| Roman Catholic | |
| Protestant | |
| Life expectancy (2020) | |
| Male | 63.6 years |
| Female | 68.8 years |
| Total population | 66.2 years (188tH) |
| Homicides | |
| n.a. | |
| Geography | |
| Land area | 101,000 km2 |
| water area | 16,600 km2 |
| total area | 117,600 km2 (102nd) |
| Mean elevation | 853 m |
| Lowest point | |
| near Kulul within the Danakil Depression | -75 m |
| Highest point | |
| Soira | 3,018 m |
| Land use (2011) | |
| Agricultural land | 75.1% |
| Arable land | 6.8% |
| Permanent crops | 0% |
| Permanent pasture | 68.3% |
| Forest | 15.1% |
| Other | 9.8% |
| Urbanization | |
| Urban population (2020) | 41.3% |
| Rate of urbanization | 3.86% annual rate of change (2015 – 2020) |
| Economy | |
| Labor force (2017) | 2.71 million (111th) |
| Labor force by occupation (2004) | |
| Agriculture | 80% |
| Industry | 20% |
| Unemployment rate (2017) | 5.8% (87th) |
| GDP (PPP) (estimate 2018) | |
| Total | $11.263 billion (156th) |
| Per capita | $1,797(180th) |
| GDP (nominal) (estimate 2018) | |
| Total | $8.116 billion (149th) |
| Per capita | $1,295 (160th) |
| GDP by sector (estimate 2017) | |
| Agriculture | 11.7% |
| Industry | 29.6% |
| Services | 58.7% |
| Exports (2017) | $624.3 million (171th) |
| Exports partners (2017) | |
| China | 62% |
| South Korea | 28.3% |
| Imports (2017) | $1.127 billion (181th) |
| Imports partners (2017) | |
| UAE | 14.5% |
| China | 13.2% |
| Saudi Arabia | 13.2% |
| Italy | 12.9% |
| Turkey | 5.6% |
| South Africa | 4.6% |
Eritrea on the world map
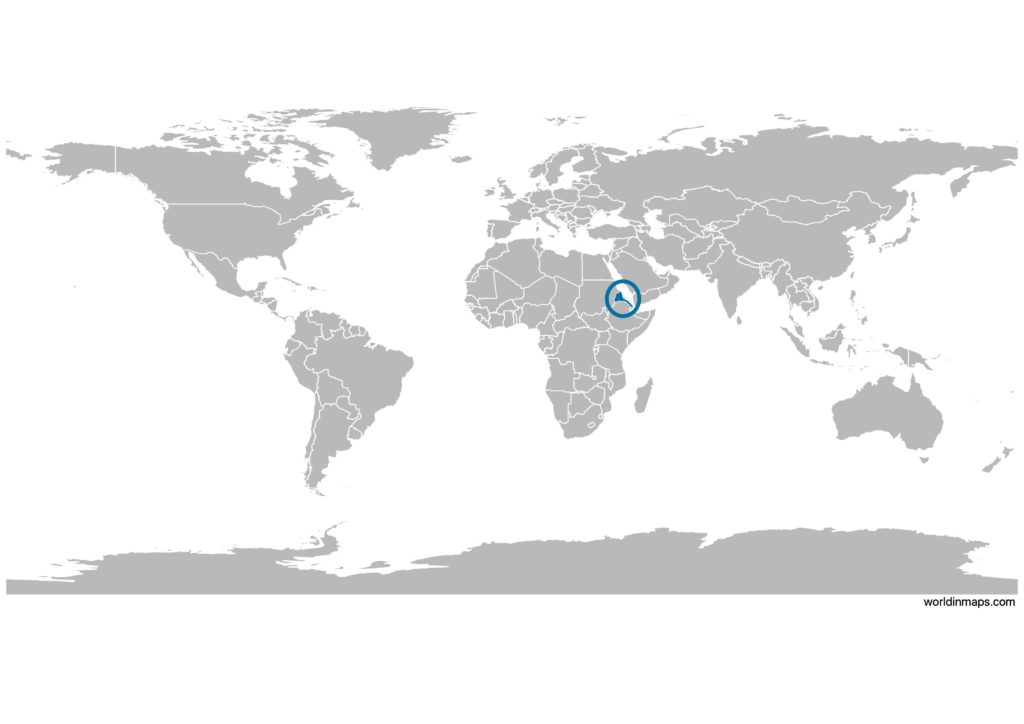
Eritrea is located in Africa in the Horn of Africa.
Eritrea top 10 largest cities
- Asmara (963,000)
- Keren (120,000)
- Massawa (54,090)
- Mendefera (53,000)
- Assab (28,000)
- Barentu (15,891)
- Adi Keyh (13,061)
- Edd (11,259)
- Dekemhare (10,959)
- Agordat (8,857)
Demography
Population pyramid
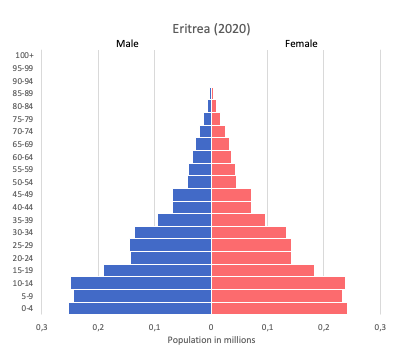
Age structure data
Estimate for 2020:
- 0-14 years: 38.23% (male 1,169,456/female 1,155,460)
- 15-24 years: 20.56% (male 622,172/female 627,858)
- 25-54 years: 33.42% (male 997,693/female 1,034,550)
- 55-64 years: 3.8% (male 105,092/female 125,735)
- 65 years and over: 4% (male 99,231/female 143,949)
Remark: the age structure of a population affects a nation’s key socioeconomic issues. Countries with young populations (high percentage under age 15) need to invest more in schools, while countries with older populations (high percentage ages 65 and over) need to invest more in the health sector. The age structure can also be used to help predict potential political issues. For example, the rapid growth of a young adult population unable to find employment can lead to unrest.
Population from 1950 to 2020
Source: United Nations, Department of Economic and Social Affairs, Population Division (2019). World Population Prospects 2019, Online Edition. Rev. 1.
Evolution of the life expectancy from 1960 to 2018
Source: World Development Indicators, The World Bank
Economy
Agriculture:
sorghum, lentils, vegetables, corn, cotton, tobacco, sisal; livestock, goats; fish
Industries:
food processing, beverages, clothing and textiles, light manufacturing, salt, cement
Exports – commodities:
gold and other minerals, livestock, sorghum, textiles, food, small industry manufactures
Imports – commodities:
machinery, petroleum products, food, manufactured goods
Time zone and current time in Eritrea
Go to our interactive map to get the current time in Eritrea