Finland
| Government | |
| Name | Republic of Finland |
| Finnish | Suomen tasavalta |
| Swedish | Republiken Finland |
| Government type | Parliamentary republic |
| Capital | Helsinki (643,272 (2018)) |
| Currency | Euro (EUR) |
| People | |
| Population (2020) | 5,540,718 (116th) |
| Density of population | 16 P/km2 (213th) |
| Nationality | Finnish |
| Official languages | |
| Finnish | |
| Swedish | |
| Ethnic groups | |
| Finn | |
| Swede | |
| Russian | |
| Estonian | |
| Romani | |
| Sami | |
| Religions (2018) | |
| Lutheran | 69.8% |
| Greek Orthodox | 1.1% |
| Other | 1.7% |
| Unspecified | 27.4% |
| Life expectancy (2020) | |
| Male | 78.4 years |
| Female | 84.4 years |
| Total population | 81.3 years (33rd) |
| Homicides | |
| Total (2018) | 1.6 per 100,000 people (116th) |
| Geography | |
| Land area | 303,815 km2 |
| water area | 34,330 km2 |
| total area | 338,145 km2 (66th) |
| Mean elevation | 164 m |
| Lowest point | |
| Baltic Sea | 0 m |
| Highest point | |
| Halti (alternatively Haltia, Haltitunturi, Haltiatunturi) | 1,328 m |
| Land use (2011) | |
| Agricultural land | 7.5% |
| Arable land | 7.4% |
| Permanent crops | 0% |
| Permanent pasture | 0.1% |
| Forest | 72.9% |
| Other | 19.6% |
| Urbanization | |
| Urban population (2020) | 85.5% |
| Rate of urbanization | 0.42% annual rate of change (2015 – 2020) |
| Economy | |
| Labor force (2017) | 2.473 million (115th) |
| Labor force by occupation (2013) | |
| Agriculture | 4% |
| Industry | 20.7% |
| Services | 75.3% |
| Unemployment rate (2017) | 8.5% (121st) |
| GDP (PPP) (estimate 2018) | |
| Total | $257 billion (60th) |
| Per capita | $46,559(24th) |
| GDP (nominal) (estimate 2018) | |
| Total | $277 billion (43rd) |
| Per capita | $50,068 (14th) |
| GDP by sector (estimate 2017) | |
| Agriculture | 2.7% |
| Industry | 28.2% |
| Services | 69.1% |
| Exports (2017) | $67.73 billion (43th) |
| Exports partners (2017) | |
| Germany | 14.2% |
| Sweden | 10.1% |
| US | 7% |
| Netherlands | 6.8% |
| China | 5.7% |
| Russia | 5.7% |
| UK | 4.5% |
| Imports (2017) | $65.26 billion (47th) |
| Imports partners (2017) | |
| Germany | 17.7% |
| Sweden | 15.8% |
| Russia | 13.1% |
| Netherlands | 8.7% |
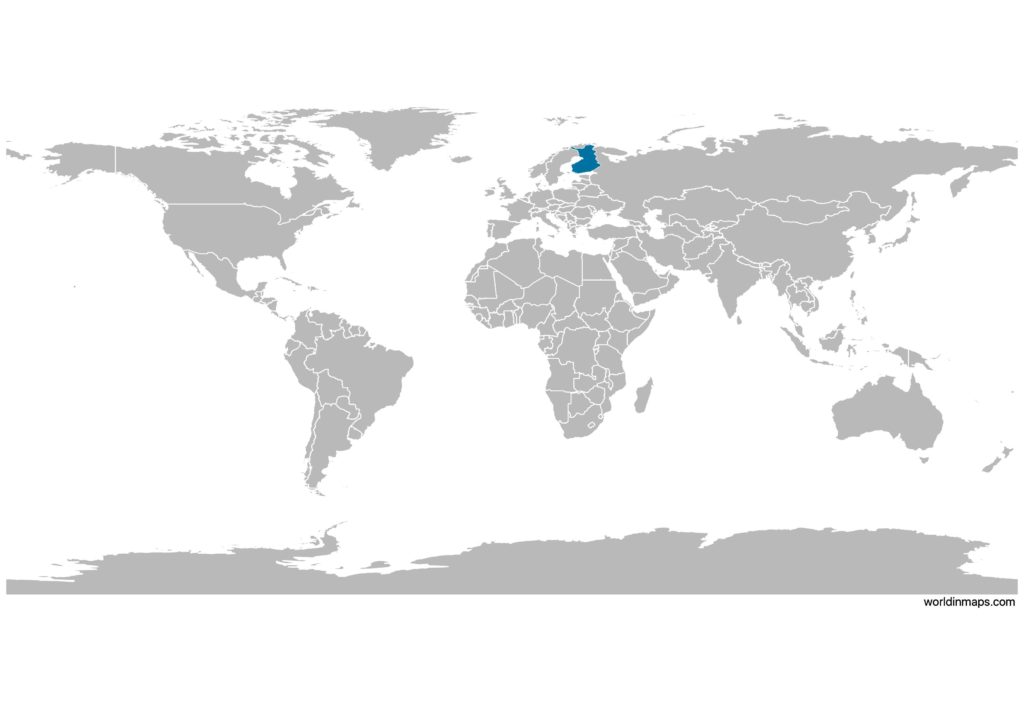
Finland on the world map
Finland top 10 largest cities (2018)
- Helsinki (643,272)
- Espoo (279,044)
- Tampere (231,853)
- Vantaa (223,027)
- Oulu (201,801)
- Turku (189,669)
- Jyväskylä (140,188)
- Lahti (119,573)
- Kuopio (118,209)
- Kouvola (84,196)
Demography
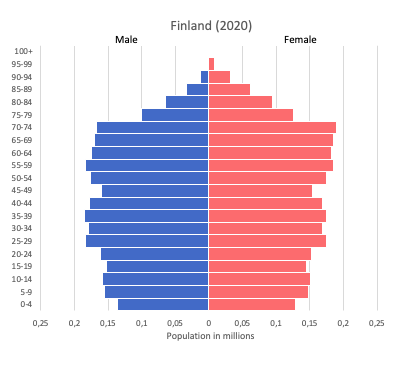
Population pyramid
Age structure data
Estimate for 2020:
- 0-14 years: 16.41% (male 467,220/female 447,005)
- 15-24 years: 10.95% (male 312,179/female 297,717)
- 25-54 years: 37.37% (male 1,064,326/female 1,017,545)
- 55-64 years: 13.02% (male 357,687/female 367,610)
- 65 years and over: 22.26% (male 543,331/female 697,045)
Remark: the age structure of a population affects a nation’s key socioeconomic issues. Countries with young populations (high percentage under age 15) need to invest more in schools, while countries with older populations (high percentage ages 65 and over) need to invest more in the health sector. The age structure can also be used to help predict potential political issues. For example, the rapid growth of a young adult population unable to find employment can lead to unrest.
Population from 1950 to 2020
Source: United Nations, Department of Economic and Social Affairs, Population Division (2019). World Population Prospects 2019, Online Edition. Rev. 1.
Evolution of the life expectancy from 1960 to 2018
Source: World Development Indicators, The World Bank
Economy
Agriculture:
barley, wheat, sugar beets, potatoes, dairy cattle, fish
Industries:
metals and metal products, electronics, machinery and scientific instruments, shipbuilding, pulp and paper, foodstuffs, chemicals, textiles, clothing
Exports – commodities:
electrical and optical equipment, machinery, transport equipment, paper and pulp, chemicals, basic metals, timber
Imports – commodities:
foodstuffs, petroleum and petroleum products, chemicals, transport equipment, iron and steel, machinery, computers, electronic industry products, textile yarn and fabrics, grains
Time zone and current time in Finland
Go to our interactive map to get the current time in Finland