Haiti
| Government | |
| Name | Republic of Haiti |
| French | République d’Haïti |
| Haitian Creole | Repiblik d Ayiti |
| Government type | Semi-presidential republic |
| Capital | Port-au-Prince (1,234,742) |
| Currency | Haitian gourde (G) |
| People | |
| Population (2020) | 11,402,533 (80th) |
| Density of population | 382 P/km2 (32nd) |
| Nationality | Haitian |
| Official languages | |
| French | |
| Creole | |
| Ethnic groups | |
| Black | 95% |
| Mixed and white | 5% |
| Religions (2003) | |
| Roman Catholic | 54.7% |
| Protestant | 28.5% |
| Baptist | 15.4% |
| Pentecostal | 7.9% |
| Adventist | 3% |
| Methodist | 1.5% |
| Other | 0.7% |
| Vodou | 2.1% |
| Other | 4.6% |
| None | 10.2% |
| Life expectancy (2020) | |
| Male | 62.6 years |
| Female | 68 years |
| Total population | 65.3 years (194th) |
| Homicides | |
| Total (2018) | 6.7 per 100,000 people (48th) |
| Geography | |
| Land area | 27,560 km2 |
| water area | 190 km2 |
| total area | 27,750 km2 (148th) |
| Mean elevation | 470 m |
| Lowest point | |
| Caribbean Sea | 0 m |
| Highest point | |
| Chaine de la Selle | 2,680 m |
| Land use (2011) | |
| Agricultural land | 66.4% |
| Arable land | 38.5% |
| Permanent crops | 10.2% |
| Permanent pasture | 17.7% |
| Forest | 3.6% |
| Other | 30% |
| Urbanization | |
| Urban population (2020) | 57.1% |
| Rate of urbanization | 2.9% annual rate of change (2015 – 2020) |
| Economy | |
| Labor force (2014) | 4.594 million (88th) |
| note: shortage of skilled labor and abundance of unskilled labor | |
| Labor force by occupation (2010) | |
| Agriculture | 38.1% |
| Industry | 11.5% |
| Services | 50.4% |
| Unemployment rate (2010) | 40.6% (215th) |
| GDP (PPP) (estimate 2017) | |
| Total | $19.979 billion (144th) |
| Per capita | $1,819 (174th) |
| GDP (nominal) (estimate 2017) | |
| Total | $7.897 billion (139th) |
| Per capita | $719 (172nd) |
| GDP by sector (estimate 2017) | |
| Agriculture | 22.1% |
| Industry | 20.3% |
| Services | 57.6% |
| Exports (2017) | $980.2 million (160th) |
| Exports partners (2017) | |
| US | 80.6% |
| Dominican Republic | 4.9% |
| Imports (2017) | $3.618 billion (143rd) |
| Imports partners (2017) | |
| US | 20.7% |
| China | 18.8% |
| Netherlands Antilles | 15.7% |
| Indonesia | 8.5% |
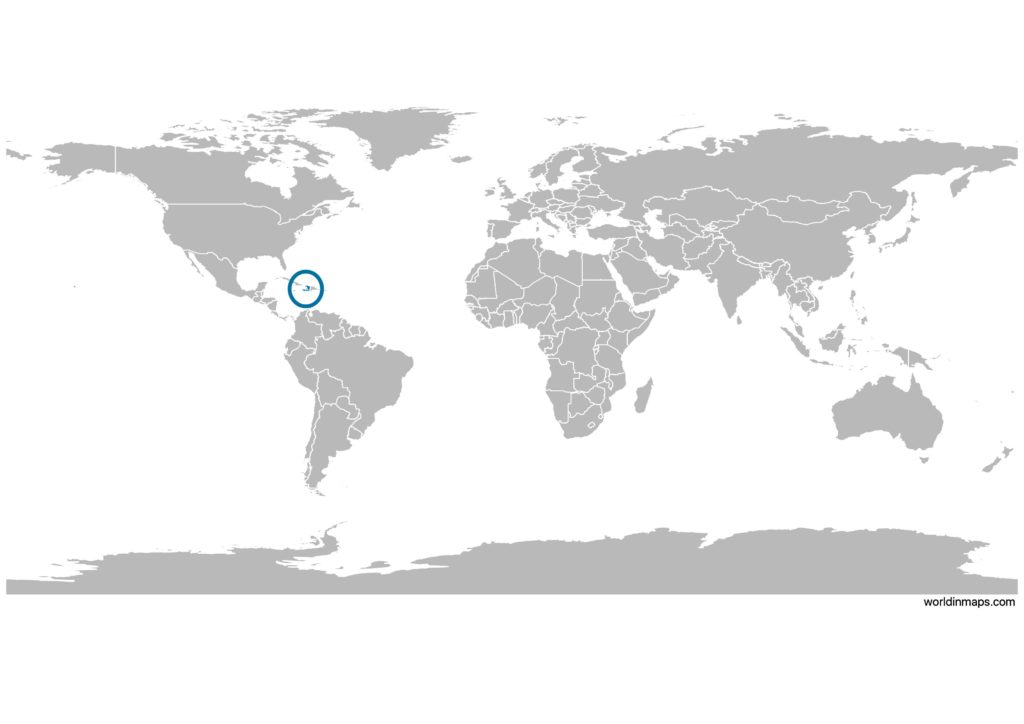
Haiti on the world map
Haiti top 10 largest cities
- Port-au-Prince (1,234,742)
- Cap-Haïtien (534,815)
- Carrefour (442,156)
- Delmas (382,920)
- Pétion-Ville (283,052)
- Port-de-Paix (250,000)
- Croix-des-Bouquets (229,127)
- Jacmel (137,966)
- Léogâne (134,190)
- Les Cayes (125,799)
Demography
Population pyramid
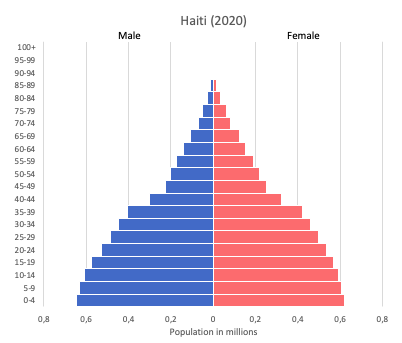
Age structure data
Estimate for 2020:
- 0-14 years: 31.21% (male 1,719,961/female 1,734,566)
- 15-24 years: 20.71% (male 1,145,113/female 1,146,741)
- 25-54 years: 38.45% (male 2,110,294/female 2,145,209)
- 55-64 years: 5.3% (male 280,630/female 305,584)
- 65 years and over: 4.33% (male 210,451/female 269,228)
Remark: the age structure of a population affects a nation’s key socioeconomic issues. Countries with young populations (high percentage under age 15) need to invest more in schools, while countries with older populations (high percentage ages 65 and over) need to invest more in the health sector. The age structure can also be used to help predict potential political issues. For example, the rapid growth of a young adult population unable to find employment can lead to unrest.
Population from 1950 to 2020
Source: United Nations, Department of Economic and Social Affairs, Population Division (2019). World Population Prospects 2019, Online Edition. Rev. 1.
Evolution of the life expectancy from 1960 to 2018
Source: World Development Indicators, The World Bank
Economy
Agriculture:
coffee, mangoes, cocoa, sugarcane, rice, corn, sorghum, wood, vetiver
Industries:
textiles, sugar refining, flour milling, cement, light assembly using imported parts
Exports – commodities:
apparel, manufactures, oils, cocoa, mangoes, coffee
Imports – commodities:
food, manufactured goods, machinery and transport equipment, fuels, raw materials
Time zone and current time in Haiti
Go to our interactive map to get the current time in Haiti