Indonesia

| Government | |
| Name | Republic of Indonesia |
| Indonesian | Republik Indonesia |
| Government type | Presidential republic |
| Capital | Jakarta (10,154,134 (2015)) |
| Currency | Indonesian rupiah (IDR) |
| People | |
| Population (2020) | 273,523,621 (4th) |
| Density of population | 138 P/km2 (88th) |
| Nationality | Indonesian |
| Official languages | |
| Indonesian (Bahasa Indonesia) note: more than 700 languages are used in Indonesia | |
| Ethnic groups (2010) | |
| Javanese | 40.1% |
| Sundanese | 15.5% |
| Malay | 3.7% |
| Batak | 3.6% |
| Madurese | 3% |
| Betawi | 2.9% |
| Minangkabau | 2.7% |
| Buginese | 2.7% |
| Bantenese | 2% |
| Banjarese | 1.7% |
| Balinese | 1.7% |
| Acehnese | 1.4% |
| Dayak | 1.4% |
| Sasak | 1.3% |
| Chinese | 1.2% |
| Other | 15% |
| Religions (2010) | |
| Muslim | 87.2% |
| Protestant | 7% |
| Roman Catholic | 2.9% |
| Hindu | 1.7% |
| Other | 0.9% |
| Unspecified | 0.4% |
| Life expectancy (2020) | |
| Male | 71.1 years |
| Female | 76.5 years |
| Total population | 73.7 years (142nd) |
| Homicides | |
| Total (2017) | 0.4 per 100,000 people (167th) |
| Geography | |
| Land area | 1,811,569 km2 |
| water area | 93,000 km2 |
| total area | 1,904,569 km2 (16th) |
| Mean elevation | 367 m |
| Lowest point | |
| Indian Ocean | 0 m |
| Highest point | |
| Puncak Jaya | 4,884 m |
| Land use (2011) | |
| Agricultural land | 31.2% |
| Arable land | 13% |
| Permanent crops | 12.1% |
| Permanent pasture | 6.1% |
| Forest | 51.7% |
| Other | 17.1% |
| Urbanization | |
| Urban population (2020) | 56.6% |
| Rate of urbanization | 2.27% annual rate of change (2015 – 2020) |
| Economy | |
| Labor force (2016) | 125 million (4th) |
| Labor force by occupation (2016) | |
| Agriculture | 32% |
| Industry | 21% |
| Services | 47% |
| Unemployment rate (2017) | 5.4% (79th) |
| GDP (PPP) (estimate 2019) | |
| Total | $3.740 trillion (7th) |
| Per capita | $14,840 (89th) |
| GDP (nominal) (estimate 2019) | |
| Total | $1.200 trillion (16th) |
| Per capita | $4,460 (106th) |
| GDP by sector (estimate 2017) | |
| Agriculture | 13.7% |
| Industry | 41% |
| Services | 45.4% |
| Exports (2017) | $168.9 billion (29th) |
| Exports partners (2017) | |
| China | 13.6% |
| US | 10.6% |
| Japan | 10.5% |
| India | 8.4% |
| Singapore | 7.6% |
| Malaysia | 5.1% |
| South Korea | 4.8% |
| Imports (2017) | $150.1 billion (31st) |
| Imports partners (2017) | |
| China | 23.2% |
| Singapore | 10.9% |
| Japan | 10% |
| Thailand | 6% |
| Malaysia | 5.6% |
| South Korea | 5.3% |
| US | 5.2% |
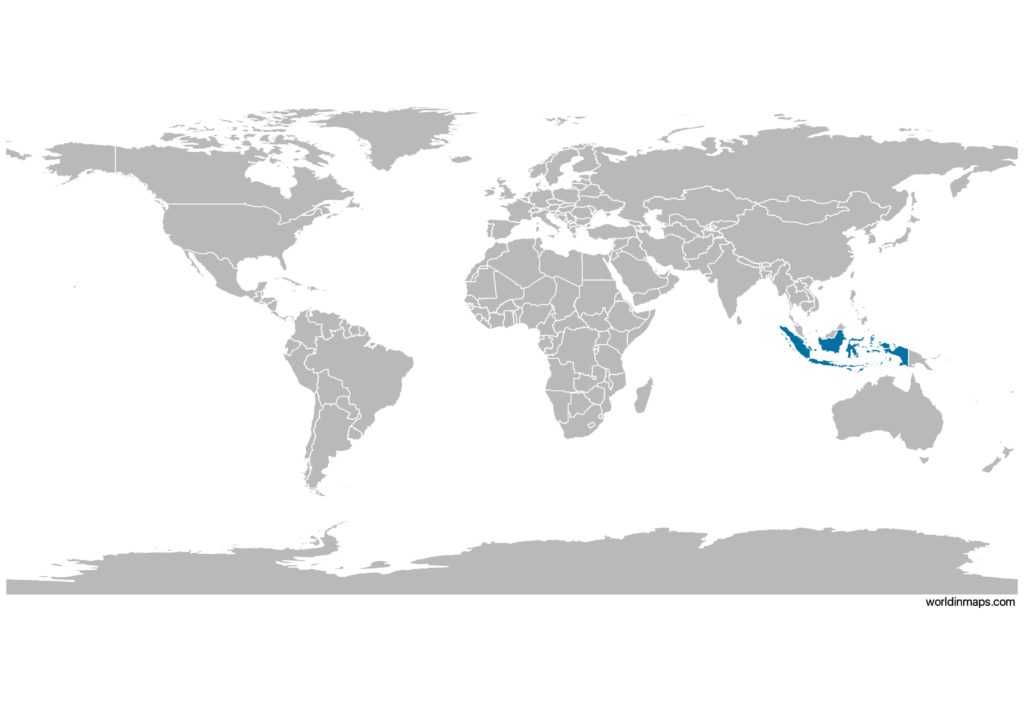
Indonesia on the world map
Indonesia top 10 largest cities (2015)
- Jakarta (10,154,134)
- Surabaya (2,847,480)
- Bekasi (2,708,721)
- Bandung (2,480,615)
- Medan (2,209,139)
- Depok (2,099,989)
- Tangerang (2,043,213)
- Semarang (1,698,777)
- Palembang (1,578,582)
- South Tangerang (1,538,970)
Demography
Population pyramid
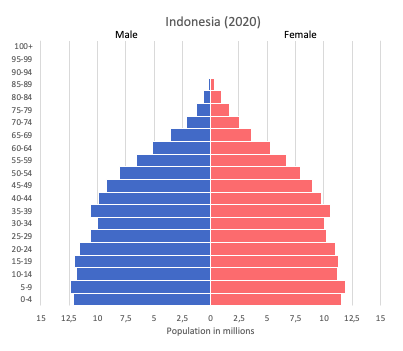
Age structure data
Estimate for 2020:
- 0-14 years: 23.87% (male 32,473,246/female 31,264,034)
- 15-24 years: 16.76% (male 22,786,920/female 21,960,130)
- 25-54 years: 42.56% (male 58,249,570/female 55,409,579)
- 55-64 years: 8.99% (male 11,033,838/female 12,968,005)
- 65 years and over: 7.82% (male 9,099,773/female 11,781,271)
Remark: the age structure of a population affects a nation’s key socioeconomic issues. Countries with young populations (high percentage under age 15) need to invest more in schools, while countries with older populations (high percentage ages 65 and over) need to invest more in the health sector. The age structure can also be used to help predict potential political issues. For example, the rapid growth of a young adult population unable to find employment can lead to unrest.
Population from 1950 to 2020
Source: United Nations, Department of Economic and Social Affairs, Population Division (2019). World Population Prospects 2019, Online Edition. Rev. 1.
Evolution of the life expectancy from 1960 to 2018
Source: World Development Indicators, The World Bank
Economy
Agriculture:
rubber and similar products, palm oil, poultry, beef, forest products, shrimp, cocoa, coffee, medicinal herbs, essential oil, fish and its similar products, and spices
Industries:
petroleum and natural gas, textiles, automotive, electrical appliances, apparel, footwear, mining, cement, medical instruments and appliances, handicrafts, chemical fertilizers, plywood, rubber, processed food, jewelry, and tourism
Exports – commodities:
mineral fuels, animal or vegetable fats (includes palm oil), electrical machinery, rubber, machinery and mechanical appliance parts
Imports – commodities:
mineral fuels, boilers, machinery, and mechanical parts, electric machinery, iron and steel, foodstuffs
Time zone and current time in Indonesia
Go to our interactive map to get the current time in Indonesia