Hungary

| Government | |
| Name | Hungary |
| Hungarian | Magyarország |
| Government type | Parliamentary republic |
| Capital | Budapest (1,752,286 (2019)) |
| Currency | Forint (HUF) |
| People | |
| Population (2020) | 9,660,350 (93rd) |
| Density of population | 105.1 P/km2 (103rd) |
| Nationality | Hungarian |
| Official languages | |
| Hungarian | |
| Ethnic groups (2011) | |
| Hungarian | 85.6% |
| Romani | 3.2% |
| German | 1.9% |
| Other | 2.6% |
| Unspecified | 14.1% |
| note: percentages add up to more than 100% because respondents were able to identify more than one ethnic group. Romani populations are usually underestimated in official statistics and may represent 5–10% of Hungary’s population | |
| Religions (2011) | |
| Roman Catholic | 37.2% |
| Calvinist | 11.6% |
| Lutheran | 2.2% |
| Greek Catholic | 1.8% |
| Other | 1.9% |
| None | 18.2% |
| No response | 27.2% |
| Life expectancy (2020) | |
| Male | 73 years |
| Female | 80.6 years |
| Total population | 76.7 years (89th) |
| Homicides | |
| Total (2017) | 2.5 per 100,000 people (92nd) |
| Geography | |
| Land area | 89,608 km2 |
| water area | 3,420 km2 |
| total area | 93,028 km2 (111th) |
| Mean elevation | 143 m |
| Lowest point | |
| Tisza River | 78 m |
| Highest point | |
| Kekes | 1,014 m |
| Land use (2011) | |
| Agricultural land | 58.9% |
| Arable land | 48.5% |
| Permanent crops | 2% |
| Permanent pasture | 8.4% |
| Forest | 22.5% |
| Other | 18.6% |
| Urbanization | |
| Urban population (2020) | 71.9% |
| Rate of urbanization | 0.07% annual rate of change (2015 – 2020) |
| Economy | |
| Labor force (2017) | 4.599 million (87th) |
| Labor force by occupation (2015) | |
| Agriculture | 4.9% |
| Industry | 30.3% |
| Services | 64.5% |
| Unemployment rate (2017) | 4.2% (54th) |
| GDP (PPP) (estimate 2020) | |
| Total | $350.000 billion (53rd) |
| Per capita | $35,941(40th) |
| GDP (nominal) (estimate 2020) | |
| Total | $180.498 billion (54th) |
| Per capita | $18,535 (47th) |
| GDP by sector (estimate 2017) | |
| Agriculture | 3.9% |
| Industry | 31.3% |
| Services | 64.8% |
| Exports (2017) | $98.74 billion (38th) |
| Exports partners (2017) | |
| Germany | 27.7% |
| Romania | 5.4% |
| Italy | 5.1% |
| Austria | 5% |
| Slovakia | 4.8% |
| France | 4.4% |
| Czech Republic | 4.4% |
| Poland | 4.3% |
| Imports (2017) | $96.3 billion (35th) |
| Imports partners (2017) | |
| Germany | 26.2% |
| Austria | 6.3% |
| China | 5.9% |
| Poland | 5.5% |
| Slovakia | 5.3% |
| Netherlands | 5% |
| Czech Republic | 4.8% |
| Italy | 4.7% |
| France | 4% |
Hungary on the world map
Hungary top 10 largest cities (2019)
- Budapest (1,752,286)
- Debrecen (201,432)
- Szeged (160,766)
- Miskolc (154,521)
- Pécs (142,873)
- Győr (132,038)
- Nyíregyháza (116,799)
- Kecskemét (110,687)
- Székesfehérvár (96,940)
- Szombathely (78,407)
Demography
Population pyramid
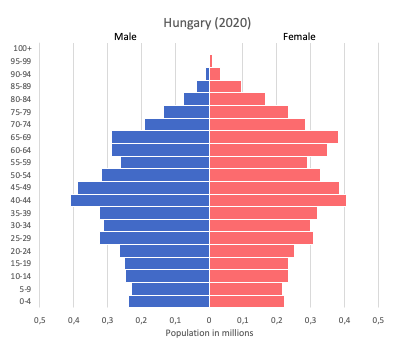
Age structure data
Estimate for 2020:
- 0-14 years: 14.54% (male 731,542/female 689,739)
- 15-24 years: 10.43% (male 526,933/female 492,388)
- 25-54 years: 42.17% (male 2,075,763/female 2,044,664)
- 55-64 years: 12.17% (male 552,876/female 636,107)
- 65 years and over: 20.69% (male 773,157/female 1,248,658)
Remark: the age structure of a population affects a nation’s key socioeconomic issues. Countries with young populations (high percentage under age 15) need to invest more in schools, while countries with older populations (high percentage ages 65 and over) need to invest more in the health sector. The age structure can also be used to help predict potential political issues. For example, the rapid growth of a young adult population unable to find employment can lead to unrest.
Population from 1950 to 2020
Source: United Nations, Department of Economic and Social Affairs, Population Division (2019). World Population Prospects 2019, Online Edition. Rev. 1.
Evolution of the life expectancy from 1960 to 2018
Source: World Development Indicators, The World Bank
Economy
Agriculture:
wheat, corn, sunflower seed, potatoes, sugar beets, pigs, cattle, poultry, dairy products
Industries:
mining, metallurgy, construction materials, processed foods, textiles, chemicals (especially pharmaceuticals), motor vehicles
Exports – commodities (2017):
machinery and equipment (55.8%), other manufactures (32.7%), food products (6.8%), raw materials (2.4%), fuels and electricity (2.3%)
Imports – commodities (2012):
machinery and equipment 45.4%, other manufactures 34.3%, fuels and electricity 12.6%, food products 5.3%, raw materials 2.5%
Time zone and current time in Hungary
Go to our interactive map to get the current time in Hungary