Jordan
| Government | |
| Name | Hashemite Kingdom of Jordan |
| Arabic | المملكة الأردنية الهاشمية Al-Mamlakah al-’Urdunniyyah Al-Hāshimiyyah |
| Government type | Parliamentary constitutional monarchy |
| Capital | Amman (1,812,059 (2015)) |
| Currency | Jordanian dinar (JOD) |
| People | |
| Population (2020) | 10,203,140 (87th) |
| Density of population | 114 P/km2 (70th) |
| Nationality | Jordanian |
| Official languages | |
| Arabic | |
| Ethnic groups (2015) | |
| Jordanian | 69.3% |
| Syrian | 13.3% |
| Palestinian | 6.7% |
| Egyptian | 6.7% |
| Iraqi | 1.4% |
| Other | 2.6% |
| Religions (2010) | |
| Muslim (official; predominantly Sunni) | 97.2% |
| Christian | 2.2% |
| Buddhist | 0.4% |
| Hindu | 0.1% |
| Jewish | <0.1% |
| Folk | <0.1% |
| Unaffiliated | <0.1% |
| Other | <0.1% |
| Life expectancy (2020) | |
| Male | 74 years |
| Female | 77.1 years |
| Total population | 75.5 years (114th) |
| Homicides | |
| Total (2017) | 1.4 per 100,000 people (123rd) |
| Geography | |
| Land area | 88,802 km2 |
| water area | 540 km2 |
| total area | 89,342 km2 (113th) |
| Mean elevation | 812 m |
| Lowest point | |
| Dead Sea | -431 m |
| Highest point | |
| Jabal Umm ad Dami | 1,854 m |
| Land use (2011) | |
| Agricultural land | 11.4% |
| Arable land | 2% |
| Permanent crops | 1% |
| Permanent pasture | 8.4% |
| Forest | 1.1% |
| Other | 87.5% |
| Urbanization | |
| Urban population (2020) | 91.4% |
| Rate of urbanization | 2.43% annual rate of change (2015 – 2020) |
| Economy | |
| Labor force (2017) | 2.295 million (117th) |
| Labor force by occupation (2013) | |
| Agriculture | 2% |
| Industry | 20% |
| Services | 78% |
| Unemployment rate (2017) | 18.3% (181st) |
| note: unofficial rate is approximately 30% | |
| GDP (PPP) (estimate 2018) | |
| Total | $93.159 billion (87th) |
| Per capita | $9,406 (86th) |
| GDP (nominal) (estimate 2018) | |
| Total | $41.869 billion (92nd) |
| Per capita | $4,228 (95th) |
| GDP by sector (estimate 2017) | |
| Agriculture | 4.5% |
| Industry | 28.8% |
| Services | 66.6% |
| Exports (2017) | $7.511 billion (98th) |
| Exports partners (2017) | |
| US | 24.9% |
| Saudi Arabia | 12.8% |
| India | 8.2% |
| Iraq | 8.2% |
| Kuwait | 5.4% |
| UAE | 4.6% |
| Imports (2017) | $18.21 billion (81st) |
| Imports partners (2017) | |
| China | 13.6% |
| Saudi Arabia | 13.6% |
| US | 9.9% |
| UAE | 4.9% |
| Germany | 4.4% |
Jordan on the world map
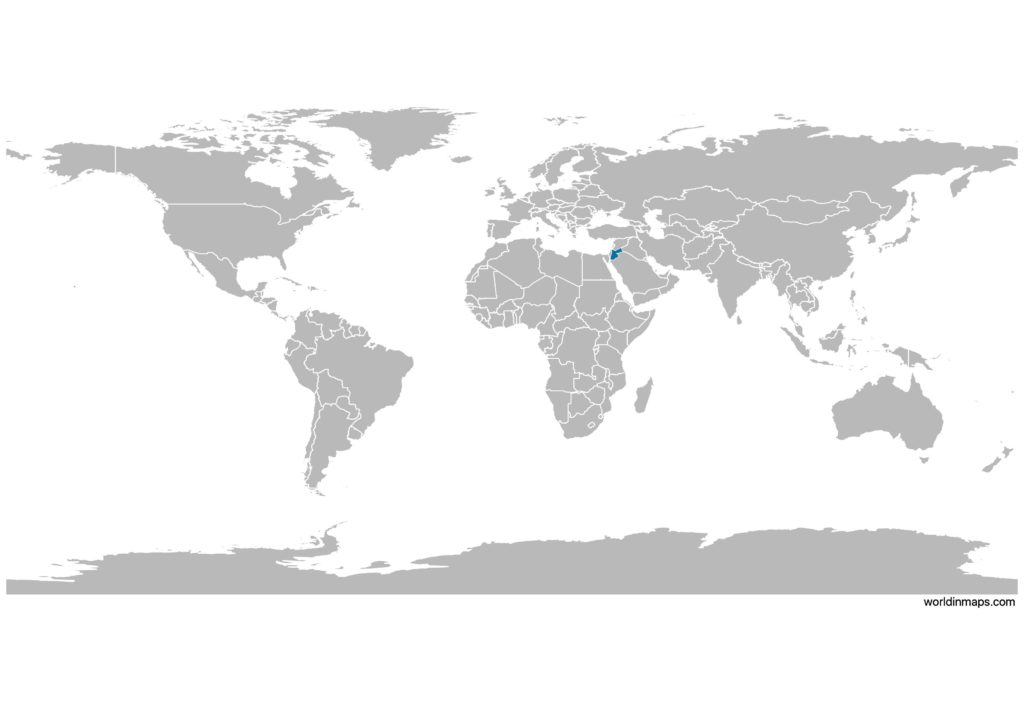
Jordan is located in Asia and more specifically in the Middle East.
Jordan top 10 largest cities (2015)
- Amman (1,812,059)
- Zarqa (635,160)
- Irbid (502,714)
- Russeifa (472,604)
- Al-Quwaysimah (296,763)
- Tla’ al-Ali (251,000)
- Wadi al-Seer (241,830)
- Jubeiha (197,160)
- Kherbet al-Souk (186,158)
- Sahab (169,434)
Demography
Population pyramid
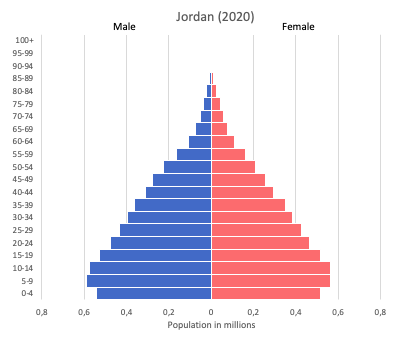
Age structure data
Estimate for 2020:
- 0-14 years: 33.05% (male 1,837,696/female 1,738,935)
- 15-24 years: 19.77% (male 1,126,567/female 1,012,812)
- 25-54 years: 38.39% (male 2,250,328/female 1,903,996)
- 55-64 years: 5.11% (male 290,633/female 262,827)
- 65 years and over: 3.67% (male 194,464/female 202,386)
Remark: the age structure of a population affects a nation’s key socioeconomic issues. Countries with young populations (high percentage under age 15) need to invest more in schools, while countries with older populations (high percentage ages 65 and over) need to invest more in the health sector. The age structure can also be used to help predict potential political issues. For example, the rapid growth of a young adult population unable to find employment can lead to unrest.
Population from 1950 to 2020
Source: United Nations, Department of Economic and Social Affairs, Population Division (2019). World Population Prospects 2019, Online Edition. Rev. 1.
Evolution of the life expectancy from 1960 to 2018
Source: World Development Indicators, The World Bank
Economy
Agriculture:
citrus, tomatoes, cucumbers, olives, strawberries, stone fruits; sheep, poultry, dairy
Industries:
tourism, information technology, clothing, fertilizer, potash, phosphate mining, pharmaceuticals, petroleum refining, cement, inorganic chemicals, light manufacturing
Exports – commodities:
textiles, fertilizers, potash, phosphates, vegetables, pharmaceuticals
Imports – commodities:
crude oil, refined petroleum products, machinery, transport equipment, iron, cereals
Time zone and current time in Jordan
Go to our interactive map to get the current time in Jordan