Laos
| Government | |
| Name | Lao People’s Democratic Republic |
| Lao | ສາທາລະນະລັດ ປະຊາທິປະໄຕ ປະຊາຊົນລາວ (Sathalanalat Paxathipatai Paxaxôn Lao ) |
| French | République démocratique populaire lao |
| Government type | communist state |
| Capital | Vientiane (820,940) |
| Currency | Kip (LAK) |
| People | |
| Population (2020) | 7,275,556 (105th) |
| Density of population | 26.7 P/km2 (151st) |
| Nationality | Lao or Laotian |
| Official languages | |
| Lao | |
| Ethnic groups (2015) | |
| Lao | 53.2% |
| Khmou | 11% |
| Hmong | 9.2% |
| Phouthay | 3.4% |
| Tai | 3.1% |
| Makong | 2.5% |
| Katong | 2.2% |
| Lue | 2% |
| Akha | 1.8% |
| other | 11.6% |
| note: officially 49 ethnic groups, but the total number of ethnic groups is estimated to be well over 200 | |
| Religions (2015) | |
| Buddhist | 64.7% |
| Christian | 1.7% |
| none | 31.4% |
| other / not stated | 2.1% |
| Life expectancy (2020) | |
| Male | 63.6 years |
| Female | 67.9 years |
| Total population | 65.7 years (193th) |
| Homicides | |
| n.a. | |
| Geography | |
| Land area | 230,800 km2 |
| water area | 6,000 km2 |
| total area | 236,800 km2 (85th) |
| Mean elevation | 710 m |
| Lowest point | |
| Mekong River | 70 m |
| Highest point | |
| Phu Bia | 2,817 m |
| Land use (2011) | |
| Agricultural land | 10.6% |
| Arable land | 6.2% |
| Permanent crops | 0.7% |
| Permanent pasture | 3.7% |
| Forest | 67.9% |
| Other | 21.5% |
| Urbanization | |
| Urban population (2020) | 36.3% |
| Rate of urbanization | 3.28% annual rate of change (2015 – 2020) |
| Economy | |
| Labor force (2017) | 3.582 million (100th) |
| Labor force by occupation (2012) | |
| Agriculture | 73.1% |
| Industry | 6.1% |
| Services | 20.6% |
| Unemployment rate (2017) | 0.7% (4th) |
| GDP (PPP) (estimate 2019) | |
| Total | $58.329 billion |
| Per capita | $8,458 |
| GDP (nominal) (estimate 2019) | |
| Total | $20.153 billion |
| Per capita | $2,670 (131st) |
| GDP by sector (estimate 2017) | |
| Agriculture | 20.9% |
| Industry | 33.2% |
| Services | 45.9% |
| Exports (2017) | $3.654 billion (120th) |
| Exports partners (2017) | |
| Thailand | 42.6% |
| China | 28.7% |
| Vietnam | 10.4% |
| India | 4.4% |
| Imports (2017) | $4.976 billion (131st) |
| Imports partners (2017) | |
| Thailand | 59.1% |
| China | 21.5% |
| Vietnam | 9.8% |
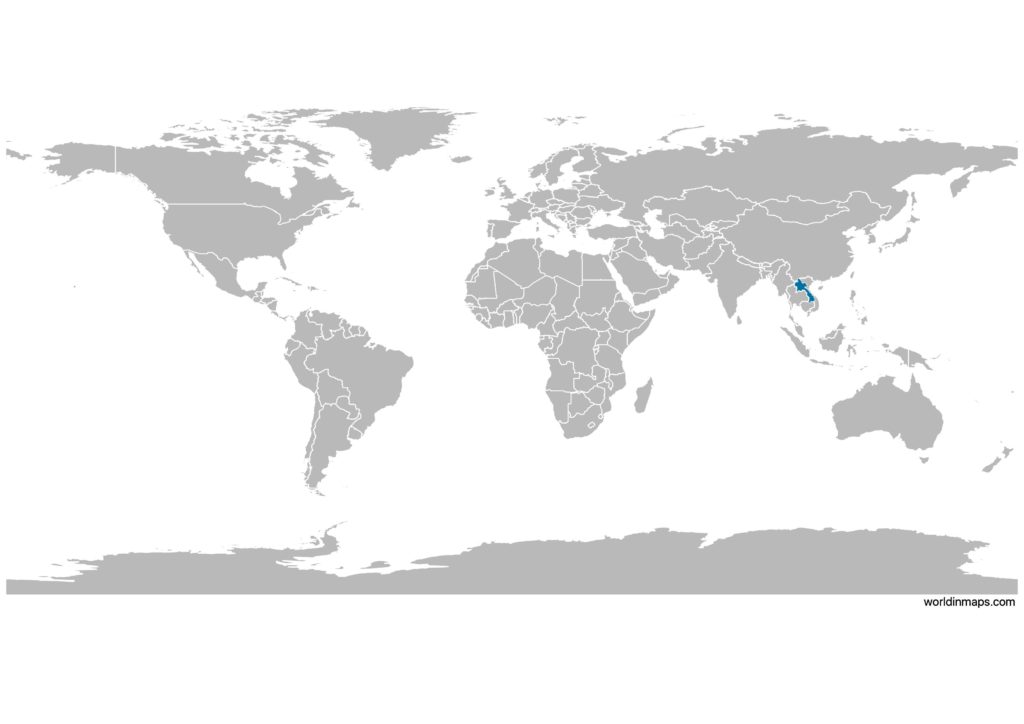
Laos on the world map
Laos top 10 largest cities
- Vientiane (820,940)
- Savannakhet (120,000)
- Pakse (119,848)
- Thakhek (85,000)
- Luang Prabang (55,027)
- Xam Neua (46,800)
- Phonsavan (37,507)
- Pakxan (27,404)
- Vang Vieng (25,000)
- Muang Xay (25,000)
Demography
Population pyramid
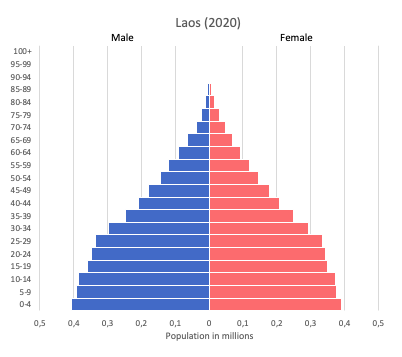
Age structure data
Estimate for 2020:
- 0-14 years: 31.25% (male 1,177,297/female 1,149,727)
- 15-24 years: 20.6% (male 763,757/female 770,497)
- 25-54 years: 38.29% (male 1,407,823/female 1,443,774)
- 55-64 years: 5.73% (male 206,977/female 219,833)
- 65 years and over: 4.13% (male 139,665/female 168,046)
Remark: the age structure of a population affects a nation’s key socioeconomic issues. Countries with young populations (high percentage under age 15) need to invest more in schools, while countries with older populations (high percentage ages 65 and over) need to invest more in the health sector. The age structure can also be used to help predict potential political issues. For example, the rapid growth of a young adult population unable to find employment can lead to unrest.
Population from 1950 to 2020
Source: United Nations, Department of Economic and Social Affairs, Population Division (2019). World Population Prospects 2019, Online Edition. Rev. 1.
Evolution of the life expectancy from 1960 to 2018
Source: World Development Indicators, The World Bank
Economy
Agriculture:
sweet potatoes, vegetables, corn, coffee, sugarcane, tobacco, cotton, tea, peanuts, rice, cassava (manioc, tapioca), water buffalo, pigs, cattle, poultry
Industries:
mining (copper, tin, gold, gypsum), timber, electric power, agricultural processing, rubber, construction, garments, cement, tourism
Exports – commodities:
wood products, coffee, electricity, tin, copper, gold, cassava
Imports – commodities:
machinery and equipment, vehicles, fuel, consumer goods
Time zone and current time in Laos
Go to our interactive map to get the current time in Laos