Vietnam
| Government | |
| Name | Socialist Republic of Vietnam |
| Vietnamese | Cộng hòa Xã hội chủ nghĩa Việt Nam |
| Government type | communist state |
| Capital | Hanoi (Hà Nội) (7,520,700 (2018)) |
| Currency | đồng (VND) |
| People | |
| Population (2020) | 97,338,583 (15th) |
| Density of population | 290.48 P/km2 (30th) |
| Nationality | Vietnamese |
| Official languages | |
| Vietnamese | |
| Ethnic groups (2009) | |
| Kinh (Viet) | 85.7% |
| Tay | 1.9% |
| Thai | 1.8% |
| Muong | 1.5% |
| Khmer | 1.5% |
| Mong | 1.2% |
| Nung | 1.1% |
| Hoa | 1% |
| other | 4.3% |
| note: 54 ethnic groups are recognized by the Vietnamese Government | |
| Religions (2009) | |
| Buddhist | 7.9% |
| Catholic | 6.6% |
| Hoa Hao | 1.7% |
| Cao Dai | 0.9% |
| Protestant | 0.9% |
| Muslim | 0.1% |
| None | 81.8% |
| Life expectancy (2020) | |
| Male | 71.9 years |
| Female | 77.1 years |
| Total population | 74.4 years (132nd) |
| Homicides | |
| Total (2011) | 1.5 per 100,000 people (118th) |
| Geography | |
| Land area | 310,070 km2 |
| water area | 21,140 km2 |
| total area | 331,210 km2 (67th) |
| Mean elevation | 398 m |
| Lowest point | |
| South China Sea | 0 m |
| Highest point | |
| Fan Si Pan | 3,144 m |
| Land use (2011) | |
| Agricultural land | 34.8% |
| Arable land | 20.6% |
| Permanent crops | 12.1% |
| Permanent pasture | 2.1% |
| Forest | 45% |
| Other | 20.2% |
| Urbanization | |
| Urban population (2020) | 37.3% |
| Rate of urbanization | 2.98% annual rate of change (2015 – 2020) |
| Economy | |
| Labor force (2017) | 54.8 million (11th) |
| Labor force by occupation (2017) | |
| Agriculture | 40.3% |
| Industry | 25.7% |
| Services | 34% |
| Unemployment rate (2017) | 2.2% (22nd) |
| GDP (PPP) (estimate 2019) | |
| Total | $770.227 billion (35th) |
| Per capita | $8,066 (128th) |
| GDP (nominal) (estimate 2019) | |
| Total | $261.637 billion (47th) |
| Per capita | $2,740 (129th) |
| GDP by sector (estimate 2017) | |
| Agriculture | 15.3% |
| Industry | 33.3% |
| Services | 51.3% |
| Exports (2017) | $214.1 billion (27th) |
| Exports partners (2017) | |
| US | 20.1% |
| China | 14.5% |
| Japan | 8% |
| South Korea | 6.8% |
| Imports (2017) | $202.6 billion (26th) |
| Imports partners (2017) | |
| China | 25.8% |
| South Korea | 20.5% |
| Japan | 7.8% |
| Thailand | 4.9% |
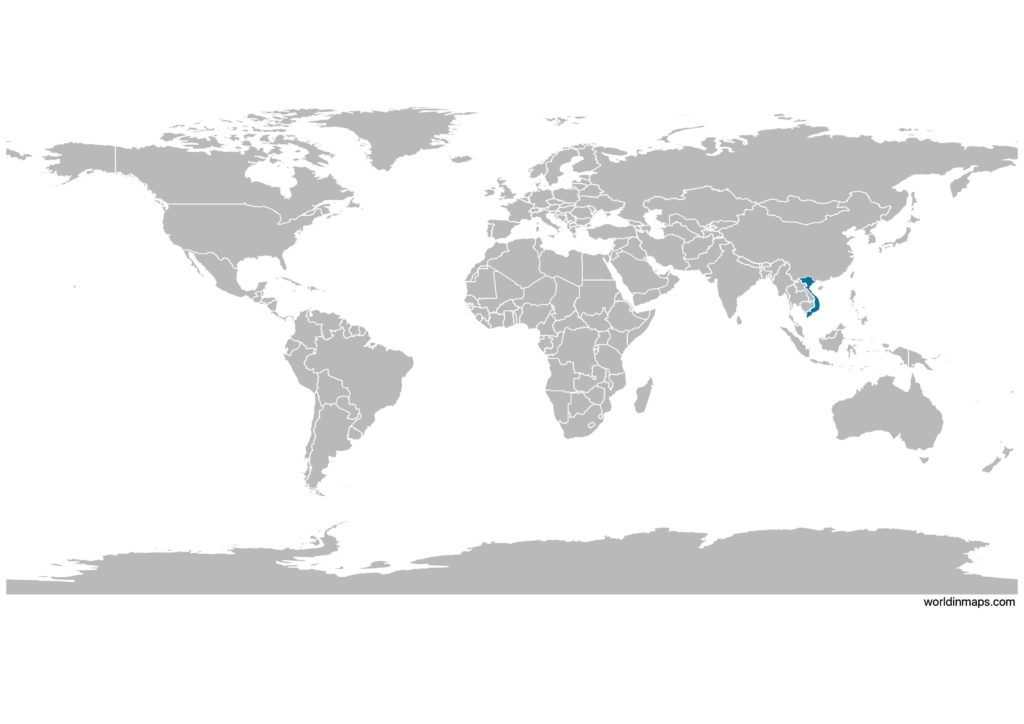
Vietnam on the world map
Vietnam top 10 largest cities (2018)
- Ho Chi Minh City (8,598,700)
- Hanoi (7,520,700)
- Haiphong (2,013,800)
- Cần Thơ (1,569,301)
- Biên Hòa (1,104,495)
- Da Nang (1,080,700)
- Nha Trang (792,397)
- Vinh (490,000)
- Hải Dương (403,893)
- Da Lat (356,393)
Demography
Population pyramid
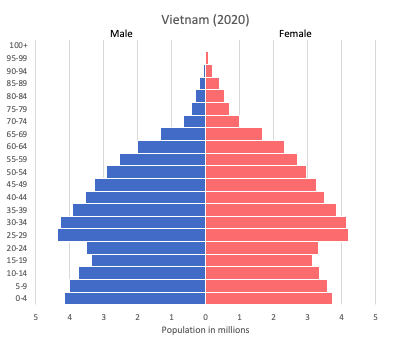
Age structure data
Estimate for 2020:
- 0-14 years: 22.61% (male 11,733,704/female 10,590,078)
- 15-24 years: 15.22% (male 7,825,859/female 7,202,716)
- 25-54 years: 45.7% (male 22,852,429/female 22,262,566)
- 55-64 years: 9.55% (male 4,412,111/female 5,016,880)
- 65 years and over: 6.91% (male 2,702,963/female 4,121,969)
Remark: the age structure of a population affects a nation’s key socioeconomic issues. Countries with young populations (high percentage under age 15) need to invest more in schools, while countries with older populations (high percentage ages 65 and over) need to invest more in the health sector. The age structure can also be used to help predict potential political issues. For example, the rapid growth of a young adult population unable to find employment can lead to unrest.
Population from 1950 to 2020
Source: United Nations, Department of Economic and Social Affairs, Population Division (2019). World Population Prospects 2019, Online Edition. Rev. 1.
Evolution of the life expectancy from 1960 to 2018
Source: World Development Indicators, The World Bank
Economy
Agriculture:
rice, coffee, rubber, tea, pepper, soybeans, cashews, sugar cane, peanuts, bananas, pork, poultry, seafood
Industries:
food processing, garments, shoes, machine-building, mining, coal, steel, cement, chemical fertilizer, glass, tires, oil, mobile phones
Exports – commodities:
clothes, shoes, electronics, seafood, crude oil, rice, coffee, wooden products, machinery
Imports – commodities:
machinery and equipment, petroleum products, steel products, raw materials for the clothing and shoe industries, electronics, plastics, automobiles
Time zone and current time in Vietnam
Go to our interactive map to get the current time in Vietnam