Palau
| Government | |
| Name | Republic of Palau |
| Palauan | Beluu er a Belau |
| Government type | presidential republic in free association with the US |
| Capital | Ngerulmud (271) – smallest capital city in the world |
| Currency | United States dollar (USD) |
| People | |
| Population (2020) | 18,092 (224th) |
| Density of population | 46.7 P/km2 |
| Nationality | Palauan |
| Official languages | |
| Palauan (official on most islands) | |
| English (official) | |
| Sonsoralese (official in Sonsoral) | |
| Tobian (official in Tobi) | |
| Angaur (official in Angaur) | |
| Japanese (official in Angaur) | |
| Ethnic groups (2015) | |
| Palauan (Micronesian with Malayan and Melanesian admixtures) | 73% |
| Carolinian | 2% |
| Asian | 21.7% |
| caucasian | 1.2% |
| other | 2.1% |
| Religions (2015) | |
| Roman Catholic | 45.3% |
| Protestant | 34.9% |
| Evangelical | 26.4% |
| Seventh Day Adventist | 6.9% |
| Assembly of God | 0.9% |
| Baptist | 0.7% |
| Modekngei (indigenous to Palau) | 5.7% |
| Muslim | 3% |
| Mormon | 1.5% |
| other | 9.7% |
| Life expectancy (2020) | |
| Male | 70.9 years |
| Female | 77.5 years |
| Total population | 74.1 years (136st) |
| Homicides | |
| Total (2018) | 11.2 per 100,000 people (30th) |
| Geography | |
| Land area | 459 km2 |
| water area | 0 km2 |
| total area | 459 km2 (198th) |
| Lowest point | |
| Pacific Ocean | 0 m |
| Highest point | |
| Mount Ngerchelchuus | 242 m |
| Land use (2011) | |
| Agricultural land | 10.8% |
| Arable land | 2.2% |
| Permanent crops | 4.3% |
| Permanent pasture | 4.3% |
| Forest | 87.6% |
| Other | 1.6% |
| Urbanization | |
| Urban population (2020) | 81% |
| Rate of urbanization | 1.77% annual rate of change (2015 – 2020) |
| Economy | |
| Labor force (2016) | 11,610 million (216th) |
| Labor force by occupation (2016) | |
| Agriculture | 1.2% |
| Industry | 12.4% |
| Services | 86.4% |
| Unemployment rate (2015) | 1.7% (15th) |
| GDP (PPP) (estimate 2018) | |
| Total | $300 million |
| Per capita | $16,296 (81st) |
| GDP (nominal) (estimate 2018) | |
| Total | $322 million |
| Per capita | $17,438 |
| GDP by sector (estimate 2016) | |
| Agriculture | 3% |
| Industry | 19% |
| Services | 78% |
| Exports (2017) | $23.17 billion (68th) |
| Exports partners (2017) | |
| Japan | 51.3% |
| US | 15.8% |
| India | 13.8% |
| Guam | 8% |
| Imports (2018) | $4.715 billion (134th) |
| Imports partners (2017) | |
| US | 33.4% |
| Guam | 15.8% |
| Japan | 15.7% |
| China | 13.5% |
| South Korea | 5.3% |
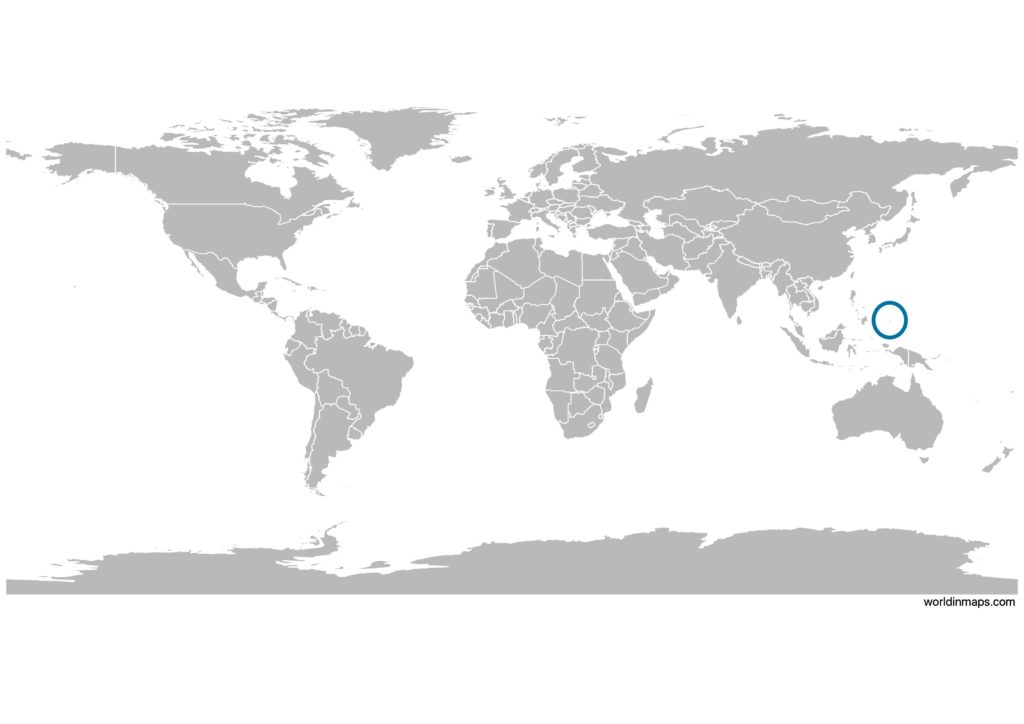
Palau on the world map
Demography
Age structure data
Estimate for 2020:
- 0-14 years: 18.68% (male 2,090/female 1,961)
- 15-24 years: 15.86% (male 1,723/female 1,716)
- 25-54 years: 45.33% (male 6,026/female 3,804)
- 55-64 years: 10.68% (male 853/female 1,463)
- 65 years and over: 9.45% (male 501/female 1,548)
Remark: the age structure of a population affects a nation’s key socioeconomic issues. Countries with young populations (high percentage under age 15) need to invest more in schools, while countries with older populations (high percentage ages 65 and over) need to invest more in the health sector. The age structure can also be used to help predict potential political issues. For example, the rapid growth of a young adult population unable to find employment can lead to unrest.
Population from 1950 to 2020
Source: United Nations, Department of Economic and Social Affairs, Population Division (2019). World Population Prospects 2019, Online Edition. Rev. 1.
Economy
Agriculture:
coconuts, cassava (manioc, tapioca), sweet potatoes, fish, pigs, chickens, eggs, bananas, papaya, breadfruit, calamansi, soursop, Polynesian chestnuts, Polynesian almonds, mangoes, taro, guava, beans, cucumbers, squash/pumpkins (various), eggplant, green onions, kangkong (watercress), cabbages (various), radishes, betel nuts, melons, peppers, noni, okra
Industries:
tourism, fishing, subsistence agriculture
Exports – commodities:
shellfish, tuna, other fish (many species)
Imports – commodities:
machinery and equipment, fuels, metals, foodstuffs
Time zone and current time in Palau
Go to our interactive map to get the current time in Palau