Sao Tome and Principe
| Government | |
| Name | Democratic Republic of Sao Tome and Principe |
| Portuguese | República Democrática de São Tomé e Príncipe |
| Government type | semi-presidential republic |
| Capital | Sao Tome (71,868 (2015)) |
| Currency | Dobra (STN) |
| People | |
| Population (2020) | 219,161 (186th) |
| Density of population | 199.7 P/km2 (69th) |
| Nationality | Sao Tomean |
| Official languages | |
| Portuguese | |
| Ethnic groups | |
| mestico | |
| angolares (descendants of Angolan slaves) | |
| forros (descendants of freed slaves) | |
| servicais (contract laborers from Angola, Mozambique, and Cabo Verde) | |
| tongas (children of servicais born on the islands) | |
| Europeans (primarily Portuguese) | |
| Asians (mostly Chinese) | |
| Religions (2012) | |
| Catholic | 55.7% |
| Adventist | 4.1% |
| Assembly of God | 3.4% |
| New Apostolic | 2.9% |
| Mana | 2.3% |
| Universal Kingdom of God | 2% |
| Jehovah’s Witness | 1.2% |
| other | 6.2% |
| none | 21.2% |
| unspecified | 1% |
| Life expectancy (2020) | |
| Male | 64.9 years |
| Female | 67.8 years |
| Total population | 66.3 years (187th) |
| Homicides | |
| Total (2011) | 3.3 per 100,000 people (79th) |
| Geography | |
| Land area | 964 km2 |
| water area | 0 km2 |
| total area | 964 km2 (185th) |
| Lowest point | |
| Atlantic Ocean | 0 m |
| Highest point | |
| Pico de Sao Tome | 2,024 m |
| Land use (2011) | |
| Agricultural land | 50.7% |
| Arable land | 9.1% |
| Permanent crops | 40.6% |
| Permanent pasture | 1% |
| Forest | 28.1% |
| Other | 21.2% |
| Urbanization | |
| Urban population (2020) | 74.4% |
| Rate of urbanization | 3.33% annual rate of change (2015 – 2020) |
| Economy | |
| Labor force (2017) | 72,600 (186th) |
| Labor force by occupation (2014) | |
| Agriculture | 26.1% |
| Industry | 21.4% |
| Services | 52.5% |
| Unemployment rate (2017) | 12.2% (163rd) |
| GDP (PPP) (estimate 2017) | |
| Total | $685 million |
| Per capita | $3,220 |
| GDP (nominal) (estimate 2017) | |
| Total | $355 million |
| Per capita | $1,668 |
| GDP by sector (estimate 2017) | |
| Agriculture | 11.8% |
| Industry | 14.8% |
| Services | 73.4% |
| Exports (2017) | $15.6 million (215th) |
| Exports partners (2017) | |
| Guyana | 43.7% |
| Germany | 23.6% |
| Portugal | 6% |
| Netherlands | 5.5% |
| Poland | 4.4% |
| Imports (2017) | $127.7 million (213th) |
| Imports partners (2017) | |
| Portugal | 54.7% |
| Angola | 16.5% |
| China | 5.6% |
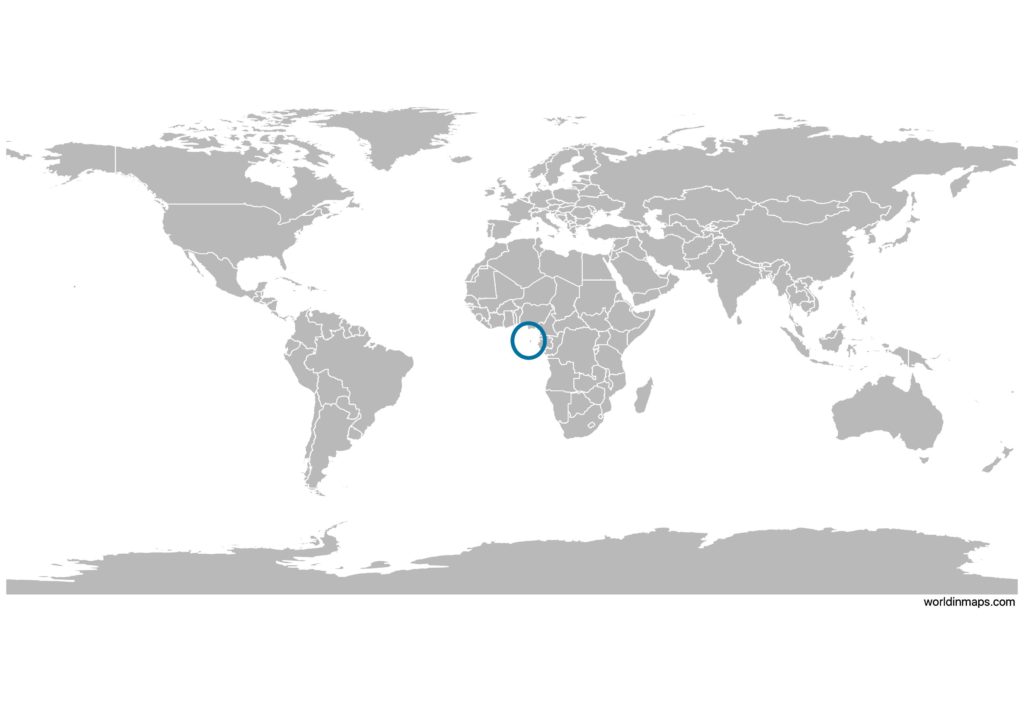
Sao Tome and Principe on the world map
Demography
Population pyramid
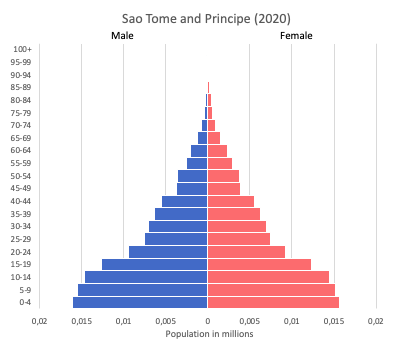
Age structure data
Estimate for 2020:
- 0-14 years: 39.77% (male 42,690/female 41,277)
- 15-24 years: 21.59% (male 23,088/female 22,487)
- 25-54 years: 31.61% (male 32,900/female 33,834)
- 55-64 years: 4.17% (male 4,095/female 4,700)
- 65 years and over: 2.87% (male 2,631/female 3,420)
Remark: the age structure of a population affects a nation’s key socioeconomic issues. Countries with young populations (high percentage under age 15) need to invest more in schools, while countries with older populations (high percentage ages 65 and over) need to invest more in the health sector. The age structure can also be used to help predict potential political issues. For example, the rapid growth of a young adult population unable to find employment can lead to unrest.
Population from 1950 to 2020
Source: United Nations, Department of Economic and Social Affairs, Population Division (2019). World Population Prospects 2019, Online Edition. Rev. 1.
Evolution of the life expectancy from 1960 to 2018
Source: World Development Indicators, The World Bank
Economy
Agriculture:
cocoa, coconuts, palm kernels, copra, cinnamon, pepper, coffee, bananas, papayas, beans, poultry, fish
Industries:
light construction, textiles, soap, beer, fish processing, timber
Exports – commodities:
cocoa 68% (2010), copra, coffee, palm oil
Imports – commodities:
machinery and electrical equipment, food products, petroleum products
Time zone and current time in Sao Tome and Principe
Go to our interactive map to get the current time in Sao Tome and Principe