Guyana
| Government | |
| Name | Co-operative Republic of Guyana |
| Government type | Parliamentary republic |
| Capital | Georgetown (235,017) |
| Currency | Guyanese dollar (GYD) |
| Organization | |
| Member State | Commonwealth of Nations |
| People | |
| Population (2020) | 786,559 (164th) |
| Density of population | 3.502 P/km2 (232nd) |
| Nationality | Guyanese |
| Official languages | |
| English | |
| Ethnic groups (2012) | |
| East Indian | 39.8% |
| African descent | 29.3% |
| Mixed | 19.9% |
| Amerindian | 10.5% |
| Other | 0.5% |
| Religions (2012) | |
| Protestant | 34.8% |
| Pentecostal | 22.8% |
| Seventh Day Adventist | 5.4% |
| Anglican | 5.2% |
| Methodist | 1.4% |
| Hindu | 24.8% |
| Roman Catholic | 7.1% |
| Muslim | 6.8% |
| Jehovah’s Witness | 1.3% |
| Rastafarian | 0.5% |
| Other Christian | 20.8% |
| Other | 0.9% |
| None | 3.1% |
| Life expectancy (2020) | |
| Male | 66.5 years |
| Female | 72.6 years |
| Total population | 69.5 years (168th) |
| Homicides | |
| Total (2018) | 14.2 per 100,000 people (24th) |
| Geography | |
| Land area | 196,849 km2 |
| water area | 18,120 km2 |
| total area | 214,969 km2 (86th) |
| Mean elevation | 207 m |
| Lowest point | |
| Atlantic Ocean | 0 m |
| Highest point | |
| Laberintos del Norte on Mount Roraima | 2,775 m |
| Land use (2011) | |
| Agricultural land | 8.4% |
| Arable land | 2.1% |
| Permanent crops | 0.1% |
| Permanent pasture | 6.2% |
| Forest | 77.4% |
| Other | 14.2% |
| Urbanization | |
| Urban population (2020) | 26.8% |
| Rate of urbanization | 0.83% annual rate of change (2015 – 2020) |
| Economy | |
| Labor force (2013) | 313,800 million (162nd) |
| Labor force by occupation | |
| Agriculture | NA |
| Industry | NA |
| Services | NA |
| Unemployment rate (2013) | 11.1% (151st) |
| GDP (PPP) (estimate 2020) | |
| Total | $13.506 billion |
| Per capita | $17,163 |
| GDP (nominal) (estimate 2020) | |
| Total | $8.065 billion |
| Per capita | $10,249 |
| GDP by sector (estimate 2017) | |
| Agriculture | 15.4% |
| Industry | 15.3% |
| Services | 69.3% |
| Exports (2017) | $1.439 billion (149th) |
| Exports partners (2017) | |
| Canada | 24.9% |
| US | 16.5% |
| Panama | 9.6% |
| UK | 7.7% |
| Jamaica | 5.1% |
| Trinidad and Tobago | 5% |
| Imports (2017) | $1.626 billion (173th) |
| Imports partners (2017) | |
| Trinidad and Tobago | 27.5% |
| US | 26.5% |
| China | 8.9% |
| Suriname | 6.1% |
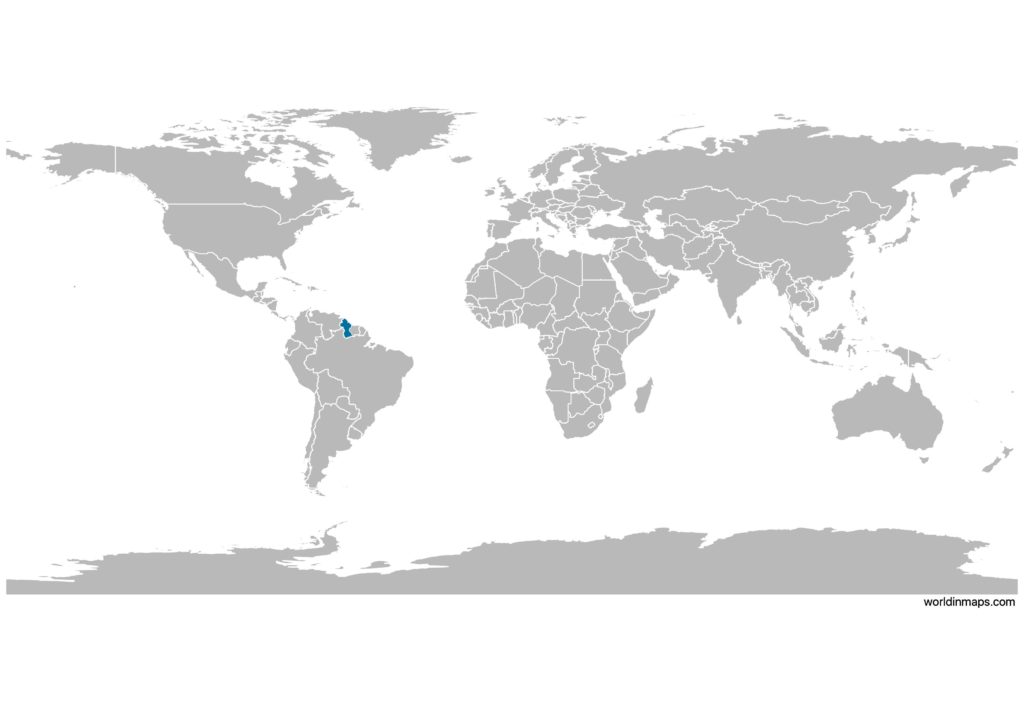
Guyana on the world map
Guyana top 10 largest cities
- Georgetown (235,017)
- Linden (44,690)
- New Amsterdam (35,039)
- Anna Regina (12,448)
- Bartica (11,157)
- Skeldon (5,859)
- Rosignol (5,782)
- Mahaica (4,867)
- Parika (4,081)
- Vreed en Hoop (3,073)
Demography
Population pyramid
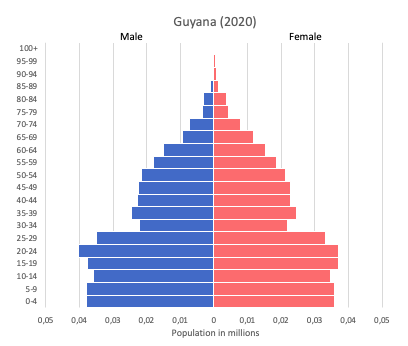
Age structure data
Estimate for 2020:
- 0-14 years: 23.91% (male 91,317/female 88,025)
- 15-24 years: 21.23% (male 81,294/female 77,987)
- 25-54 years: 39.48% (male 154,825/female 141,385)
- 55-64 years: 8.37% (male 29,385/female 33,386)
- 65 years and over: 7.01% (male 21,325/female 31,275)
Remark: the age structure of a population affects a nation’s key socioeconomic issues. Countries with young populations (high percentage under age 15) need to invest more in schools, while countries with older populations (high percentage ages 65 and over) need to invest more in the health sector. The age structure can also be used to help predict potential political issues. For example, the rapid growth of a young adult population unable to find employment can lead to unrest.
Population from 1950 to 2020
Source: United Nations, Department of Economic and Social Affairs, Population Division (2019). World Population Prospects 2019, Online Edition. Rev. 1.
Evolution of the life expectancy from 1960 to 2018
Source: World Development Indicators, The World Bank
Economy
Agriculture:
sugarcane, rice, edible oils, beef, pork, poultry, shrimp, fish
Industries:
bauxite, sugar, rice milling, timber, textiles, gold mining
Exports – commodities:
sugar, gold, bauxite, alumina, rice, shrimp, molasses, rum, timber
Imports – commodities:
manufactures, machinery, petroleum, food
Time zone and current time in Guyana
Go to our interactive map to get the current time in Guyana