Slovenia
| Government | |
| Name | Republic of Slovenia |
| Slovene | Republika Slovenija |
| Government type | parliamentary republic |
| Capital | Ljubljana (284,355 (2019)) |
| Currency | Euro (EUR) |
| People | |
| Population (2020) | 2,078,932 (147th) |
| Density of population | 102 P/km2 (106th) |
| Nationality | Slovene |
| Official languages | |
| Slovene | |
| Ethnic groups (2002) | |
| Slovene | 83.1% |
| Serb | 2% |
| Croat | 1.8% |
| Bosniak | 1.1% |
| other or unspecified | 12% |
| Religions (2002) | |
| Catholic | 57.8% |
| Muslim | 2.4% |
| Orthodox | 2.3% |
| other Christian | 0.9% |
| unaffiliated | 3.5% |
| other or unspecified | 23% |
| none | 10.1% |
| Life expectancy (2020) | |
| Male | 78.5 years |
| Female | 84.4 years |
| Total population | 81.4 years (32nd) |
| Homicides | |
| Total (2018) | 0.5 per 100,000 people (164th) |
| Geography | |
| Land area | 20,151 km2 |
| water area | 122 km2 |
| total area | 20,273 km2 (155th) |
| Mean elevation | 492 m |
| Lowest point | |
| Adriatic Sea | 0 m |
| Highest point | |
| Triglav | 2,864 m |
| Land use (2011) | |
| Agricultural land | 22.8% |
| Arable land | 8.4% |
| Permanent crops | 1.3% |
| Permanent pasture | 13.1% |
| Forest | 62.3% |
| Other | 14.9% |
| Urbanization | |
| Urban population (2020) | 55.1% |
| Rate of urbanization | 0.56% annual rate of change (2015 – 2020) |
| Economy | |
| Labor force (2017) | 959,000 (145th) |
| Labor force by occupation (2017) | |
| Agriculture | 5.5% |
| Industry | 31.2% |
| Services | 63.3% |
| Unemployment rate (2017) | 6.6% (98th) |
| GDP (PPP) (estimate 2020) | |
| Total | $83 billion (93rd) |
| Per capita | $40,343 (37th) |
| GDP (nominal) (estimate 2020) | |
| Total | $56 billion (80th) |
| Per capita | $27,452 (34th) |
| GDP by sector (estimate 2017) | |
| Agriculture | 1.8% |
| Industry | 32.2% |
| Services | 65.9% |
| Exports (2017) | $32.14 billion (61st) |
| Exports partners (2017) | |
| Germany | 18.9% |
| Italy | 10.7% |
| Austria | 7.4% |
| Croatia | 7.1% |
| France | 4.8% |
| Poland | 4.2% |
| Hungary | 4.2% |
| Imports (2017) | $30.38 billion (68th) |
| Imports partners (2017) | |
| Germany | 16.5% |
| Italy | 13.5% |
| Austria | 9.3% |
| Turkey | 5.8% |
| Croatia | 4.8% |
| China | 4.5% |
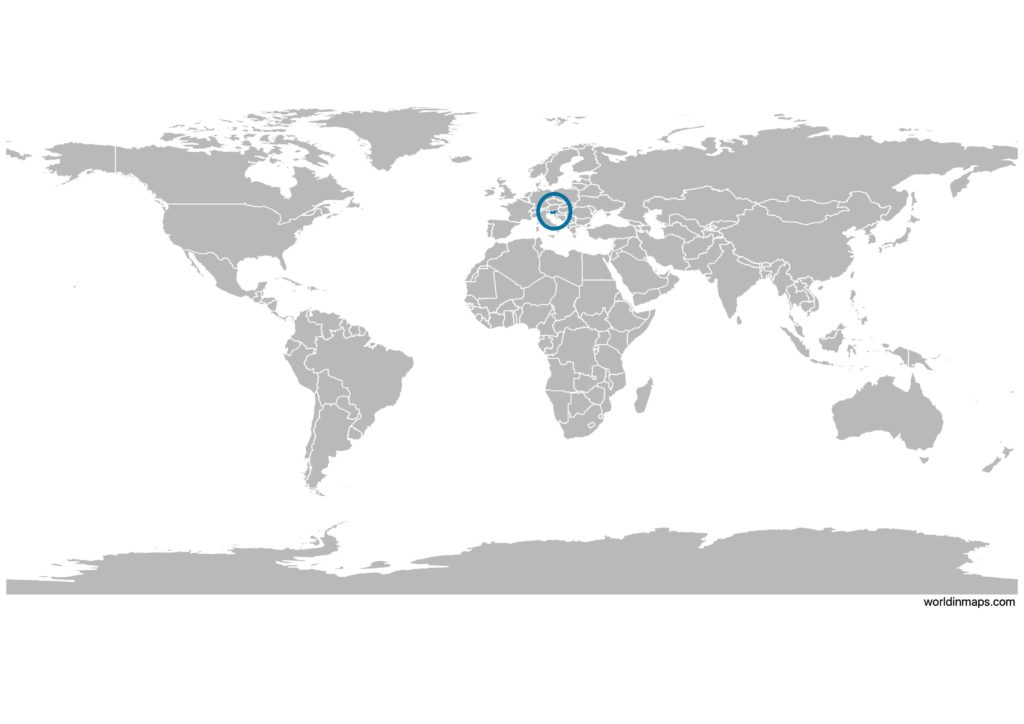
Slovenia on the world map
Slovenia top 10 largest cities (2019)
- Ljubljana (284,355)
- Maribor (95,767)
- Celje (37,875)
- Kranj (37,463)
- Koper (25,611)
- Velenje (25,327)
- Novo Mesto (23,719)
- Ptuj (17,858)
- Kamnik (13,742)
- Trbovlje (13,718)
Demography
Population pyramid
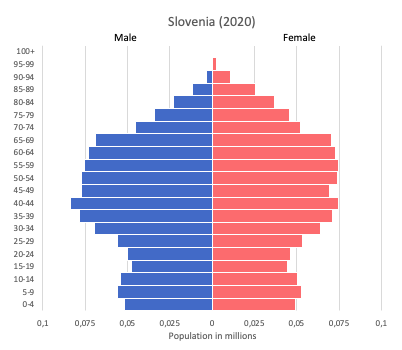
Age structure data
Estimate for 2020:
- 0-14 years: 14.84% (male 160,134/female 151,960)
- 15-24 years: 9.01% (male 98,205/female 91,318)
- 25-54 years: 40.73% (male 449,930/female 406,395)
- 55-64 years: 14.19% (male 148,785/female 149,635)
- 65 years and over: 21.23% (male 192,420/female 253,896)
Remark: the age structure of a population affects a nation’s key socioeconomic issues. Countries with young populations (high percentage under age 15) need to invest more in schools, while countries with older populations (high percentage ages 65 and over) need to invest more in the health sector. The age structure can also be used to help predict potential political issues. For example, the rapid growth of a young adult population unable to find employment can lead to unrest.
Population from 1950 to 2020
Source: United Nations, Department of Economic and Social Affairs, Population Division (2019). World Population Prospects 2019, Online Edition. Rev. 1.
Evolution of the life expectancy from 1960 to 2018
Source: World Development Indicators, The World Bank
Economy
Agriculture:
hops, wheat, coffee, corn, apples, pears, cattle, sheep, poultry
Industries:
ferrous metallurgy and aluminum products, lead and zinc smelting, electronics (including military electronics), trucks, automobiles, electric power equipment, wood products, textiles, chemicals, machine tools
Exports – commodities:
manufactured goods, machinery and transport equipment, chemicals, food
Imports – commodities:
machinery and transport equipment, manufactured goods, chemicals, fuels and lubricants, food
Time zone and current time in Slovenia
Go to our interactive map to get the current time in Slovenia