Uruguay
| Government | |
| Name | Oriental Republic of Uruguay |
| Spanish | República Oriental del Uruguay |
| Government type | presidential republic |
| Capital | Montevideo (1,304,687) |
| Currency | Uruguayan peso (UYU) |
| People | |
| Population (2020) | 3,473,727 (132nd) |
| Density of population | 19.8 P/km2 (99th) |
| Nationality | Uruguayan |
| Official languages | |
| Spanish | |
| Ethnic groups (2011) | |
| white | 87.7% |
| black | 4.6% |
| indigenous | 2.4% |
| other | 0.3% |
| none or unspecified | 5% |
| Religions (2006) | |
| Roman Catholic | 47.1% |
| non-Catholic Christians | 11.1% |
| nondenominational | 23.2% |
| Jewish | 0.3% |
| atheist or agnostic | 17.2% |
| other | 1.1% |
| Life expectancy (2020) | |
| Male | 74.8 years |
| Female | 81.2 years |
| Total population | 77.9 years (73rd) |
| Homicides | |
| Total (2018) | 12.1 per 100,000 people (27th) |
| Geography | |
| Land area | 175,015 km2 |
| water area | 1,200 km2 |
| total area | 176,215 km2 (92nd) |
| Mean elevation | 109 m |
| Lowest point | |
| Atlantic Ocean | 0 m |
| Highest point | |
| Cerro Catedral | 514 m |
| Land use (2011) | |
| Agricultural land | 87.2% |
| Arable land | 10.1% |
| Permanent crops | 0.2% |
| Permanent pasture | 76.9% |
| Forest | 10.2% |
| Other | 2.6% |
| Urbanization | |
| Urban population (2020) | 95.5% |
| Rate of urbanization | 0.46% annual rate of change (2015 – 2020) |
| Economy | |
| Labor force (2017) | 1.748 million (127th) |
| Labor force by occupation (2010) | |
| Agriculture | 13% |
| Industry | 14% |
| Services | 73% |
| Unemployment rate (2017) | 7.6% (112th) |
| GDP (PPP) (estimate 2020) | |
| Total | $86.562 billion (92nd) |
| Per capita | $24,516 (59th) |
| GDP (nominal) (estimate 2020) | |
| Total | $62.917 billion (80th) |
| Per capita | $17,819 (49th) |
| GDP by sector (estimate 2017) | |
| Agriculture | 6.2% |
| Industry | 24.1% |
| Services | 69.7% |
| Exports (2017) | $11.41 billion (86th) |
| Exports partners (2017) | |
| China | 19% |
| Brazil | 16.1% |
| US | 5.7% |
| Argentina | 5.4% |
| Imports (2017) | $8.607 billion (106th) |
| Imports partners (2017) | |
| China | 20% |
| Brazil | 19.5% |
| Argentina | 12.6% |
| US | 10.9% |
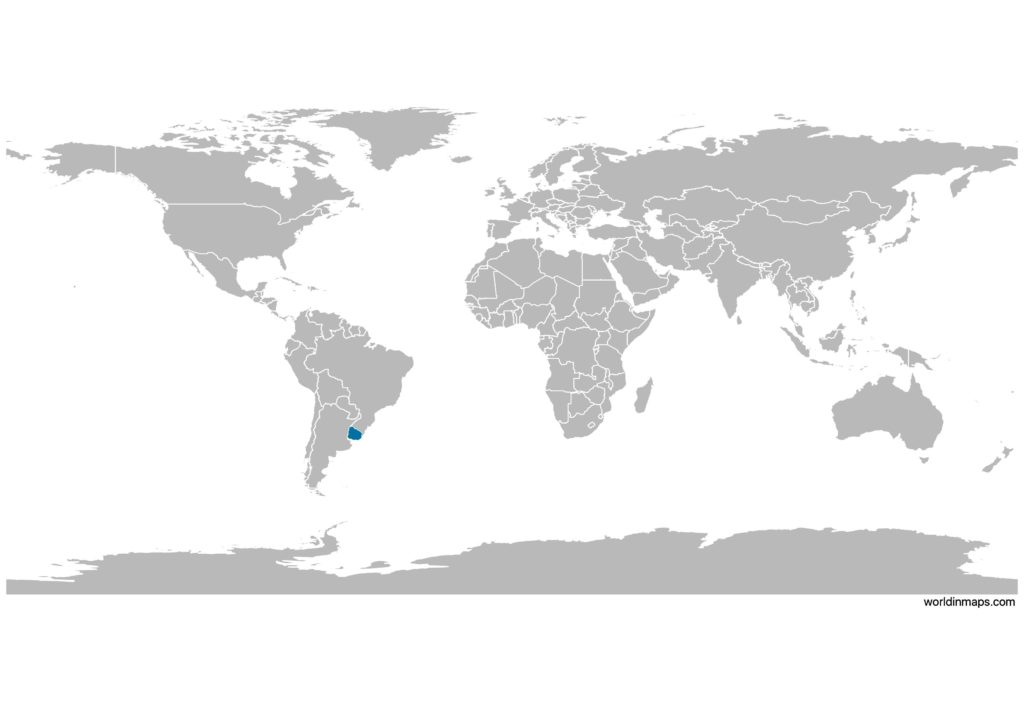
Uruguay on the world map
Uruguay top 10 largest cities
- Montevideo (1,304,687)
- Salto (104,011)
- Ciudad de la Costa (95,176)
- Paysandú (76,412)
- Las Piedras (71,258)
- Rivera (64,465)
- Maldonado (62,590)
- Tacuarembó (54,755)
- Melo (51,830)
- Mercedes (41,974)
Demography
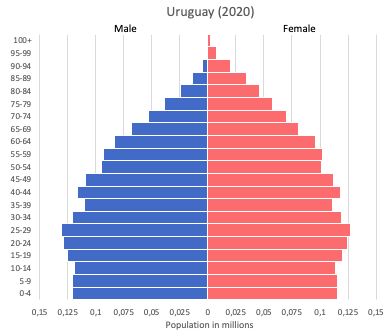
Population pyramid
Age structure data
Estimate for 2020:
- 0-14 years: 19.51% (male 336,336/female 324,563)
- 15-24 years: 15.14% (male 259,904/female 252,945)
- 25-54 years: 39.86% (male 670,295/female 679,850)
- 55-64 years: 10.79% (male 172,313/female 193,045)
- 65 years and over: 14.71% (male 200,516/female 297,838)
Remark: the age structure of a population affects a nation’s key socioeconomic issues. Countries with young populations (high percentage under age 15) need to invest more in schools, while countries with older populations (high percentage ages 65 and over) need to invest more in the health sector. The age structure can also be used to help predict potential political issues. For example, the rapid growth of a young adult population unable to find employment can lead to unrest.
Population from 1950 to 2020
Source: United Nations, Department of Economic and Social Affairs, Population Division (2019). World Population Prospects 2019, Online Edition. Rev. 1.
Evolution of the life expectancy from 1960 to 2018
Source: World Development Indicators, The World Bank
Economy
Agriculture:
Cellulose, beef, soybeans, rice, wheat; dairy products; fish; lumber, tobacco, wine
Industries:
food processing, electrical machinery, transportation equipment, petroleum products, textiles, chemicals, beverages
Exports – commodities:
beef, soybeans, cellulose, rice, wheat, wood, dairy products, wool
Imports – commodities:
refined oil, crude oil, passenger and other transportation vehicles, vehicle parts, cellular phones
Time zone and current time in Uruguay
Go to our interactive map to get the current time in Uruguay