Zimbabwe
| Government | |
| Name | Republic of Zimbabwe |
| Government type | presidential republic |
| Capital | Harare (1,485,231 (2012)) |
| Currency | Zimbabwe dollar (ZWL) |
| People | |
| Population (2020) | 14,862,927 (74th) |
| Density of population | 26 P/km2 (170th) |
| Nationality | Zimbabwean |
| Official languages | |
| Shona | |
| Ndebele | |
| English | |
| Chewa | |
| Chibarwe | |
| Kalanga | |
| Koisan | |
| Nambya | |
| Ndau | |
| Shangani | |
| sign language | |
| Sotho | |
| Tonga | |
| Tswana | |
| Venda | |
| Xhosa | |
| Ethnic groups (2012) | |
| African | 99.4% |
| other | 0.4% |
| unspecified | 0.2% |
| Religions (2015) | |
| Protestant | 74.8% |
| Apostolic | 37.5% |
| Pentecostal | 21.8% |
| other | 15.5% |
| Roman Catholic | 7.3% |
| other Christian | 5.3% |
| traditional | 1.5% |
| Muslim | 0.5% |
| other | 0.1% |
| none | 10.5% |
| Life expectancy (2020) | |
| Male | 60.2 years |
| Female | 64.5 years |
| Total population | 62.3 years (210th) |
| Homicides | |
| Total (2012) | 7.5 per 100,000 people (43rd) |
| Geography | |
| Land area | 386,847 km2 |
| water area | 3,910 km2 |
| total area | 390,757 km2 (62nd) |
| Mean elevation | 961 m |
| Lowest point | |
| junction of the Runde and Save Rivers | 162 m |
| Highest point | |
| Inyangani | 2,592 m |
| Land use (2011) | |
| Agricultural land | 42.5% |
| Arable land | 10.9% |
| Permanent crops | 0.3% |
| Permanent pasture | 31.3% |
| Forest | 39.5% |
| Other | 18% |
| Urbanization | |
| Urban population (2020) | 32.2% |
| Rate of urbanization | 2.19% annual rate of change (2015 – 2020) |
| Economy | |
| Labor force (2017) | 7.907 million (64th) |
| Labor force by occupation (2017) | |
| Agriculture | 67.5% |
| Industry | 7.3% |
| Services | 25.2% |
| Unemployment rate (2014) | 11.3% (154th) |
| note: include both unemployment and underemployment | |
| GDP (PPP) (estimate 2019) | |
| Total | $41.031 billion |
| Per capita | $2,621 |
| GDP (nominal) (estimate 2019) | |
| Total | $22.290 billion |
| Per capita | $1,424 |
| GDP by sector (estimate 2017) | |
| Agriculture | 12% |
| Industry | 22.2% |
| Services | 65.8% |
| Exports (2017) | $4.353 billion (113th) |
| Exports partners (2017) | |
| South Africa | 50.3% |
| Mozambique | 22.5% |
| UAE | 9.8% |
| Zambia | 4.9% |
| Imports (2017) | $5.472 billion (122nd) |
| Imports partners (2017) | |
| South Africa | 47.8% |
| Zambia | 20.5% |
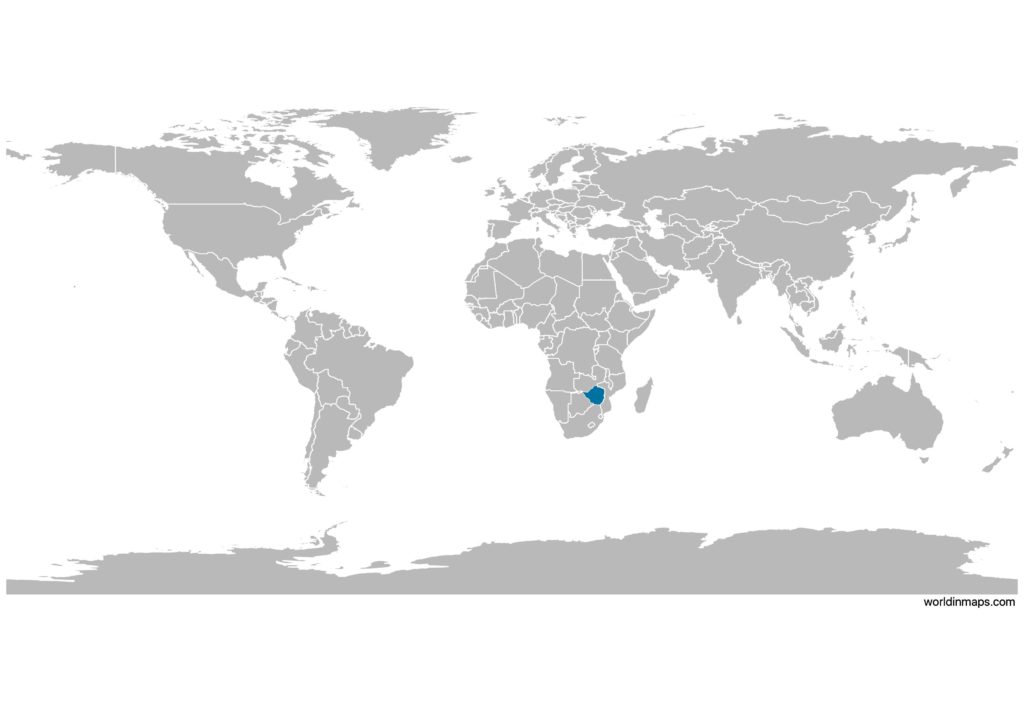
Zimbabwe on the world map
Zimbabwe top 10 largest cities (2012)
- Harare (1,485,231)
- Bulawayo (653,337)
- Chitungwiza (356,840)
- Mutare (186,208)
- Epworth (167,462)
- Gweru (154,825)
- Kwekwe (100,900)
- Kadoma (91,633)
- Masvingo (87,886)
- Chinhoyi (68,273)
Demography
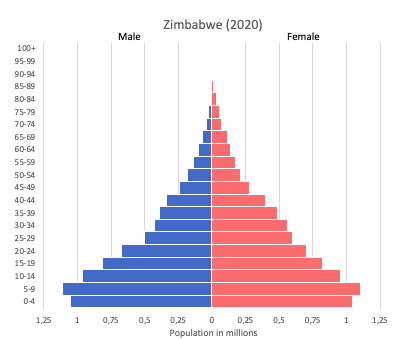
Population pyramid
Age structure data
Estimate for 2020:
- 0-14 years: 38.32% (male 2,759,155/female 2,814,462)
- 15-24 years: 20.16% (male 1,436,710/female 1,495,440)
- 25-54 years: 32.94% (male 2,456,392/female 2,334,973)
- 55-64 years: 4.07% (male 227,506/female 363,824)
- 65 years and over: 4.52% (male 261,456/female 396,396)
Remark: the age structure of a population affects a nation’s key socioeconomic issues. Countries with young populations (high percentage under age 15) need to invest more in schools, while countries with older populations (high percentage ages 65 and over) need to invest more in the health sector. The age structure can also be used to help predict potential political issues. For example, the rapid growth of a young adult population unable to find employment can lead to unrest.
Population from 1950 to 2020
Source: United Nations, Department of Economic and Social Affairs, Population Division (2019). World Population Prospects 2019, Online Edition. Rev. 1.
Evolution of the life expectancy from 1960 to 2018
Source: World Development Indicators, The World Bank
Major rivers
Economy
Agriculture:
tobacco, corn, cotton, wheat, coffee, sugarcane, peanuts, sheep, goats, pigs
Industries:
mining (coal, gold, platinum, copper, nickel, tin, diamonds, clay, numerous metallic and nonmetallic ores), steel, wood products, cement, chemicals, fertilizer, clothing and footwear, foodstuffs, beverages
Exports – commodities:
platinum, cotton, tobacco, gold, ferroalloys, textiles/clothing
Imports – commodities:
machinery and transport equipment, other manufactures, chemicals, fuels, food products
Time zone and current time in Zimbabwe
Go to our interactive map to get the current time in Zimbabwe